All official European Union website addresses are in the europa.eu domain.
See all EU institutions and bodiesAn official website of the European Union | How do you know?
Environmental information systems
EN
European Environment Agency
What we do
Together with our Eionet network, we provide the knowledge and the data needed to achieve sustainability in Europe.
We support policies with evidence-based knowledge
to help the European Union and our member countries achieve sustainability

We build and maintain networks and partnerships
to facilitate sharing of knowledge and expertise across Europe
We inform public and policy discussions
on sustainability solutions and challenges

We collect, quality check and disseminate data,
making full use of digitalisation and latest innovative technologies
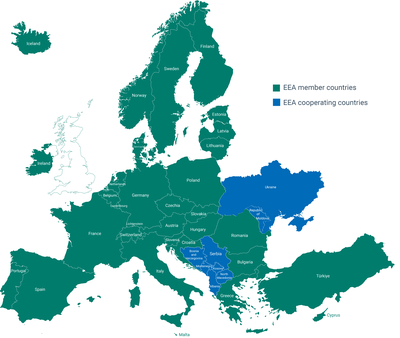
Stronger together: Welcome Ukraine
Ukraine joins us at a challenging moment in its history. The Russian war of aggression has inflicted devastating human suffering and caused environmental damage, the impacts of which will persist long after the fighting ends.
This is more than an institutional milestone. As Moldova and Ukraine are given the green light to start accession negotiations with the EU, our cooperation is a small but concrete contribution towards a shared European commitment to strengthen peace, security and prosperity across our continent.

EEA Executive Director