Key messages
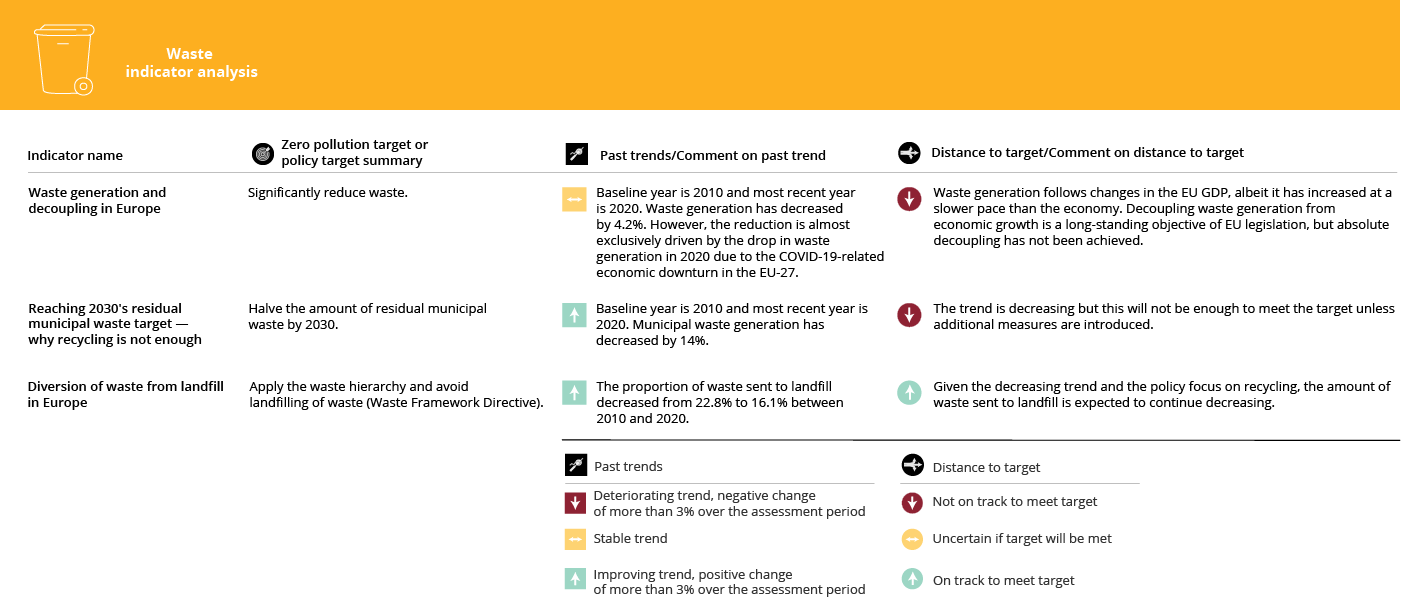
- Waste generation has been increasing in the EU, except for a significant drop in 2020 following the COVID-19-related downturn of the EU economy. The zero pollution action plan target to significantly reduce total waste generation by 2030 is unlikely to be met.
- Moreover, the target of halving the amount of residual municipal waste by 2030 is also unlikely to be met. The only way to achieve a significant reduction would be to improve waste prevention and reach recycling levels that go even further than the targets already set in EU legislation.
- The amount of municipal waste sent to landfill has decreased since 2010 and stands at 16% of generated waste in 2020. This has helped reduce pollution, as demonstrated by falling methane emissions from landfill operations.

Guidance for interpreting the summary
The figure above summarises the overall findings on waste management. Two dimensions are considered:
- whether the recent trend in pollution is positive, negative or uncertain
- the current 'distance to target', based on an assessment of the current trends or status, and whether or not the EU is on track to achieve the defined zero pollution targets for 2030 and/or other relevant policy targets.
The assessment is based on a combination of (1) available indicators and data, and (2) expert judgement.
Introduction
Waste is a significant source of pollution, especially if mismanaged. For this reason, preventing its generation and ensuring sound waste management are long-standing objectives of EU policy. Similar to the zero pollution hierarchy, the EU waste hierarchy calls for a focus on preventing waste generation so that pollution associated with waste management operations is avoided altogether. The least preferable waste treatment options in the waste hierarchy are the ones associated with the most pollution; for example, disposing of waste in landfill or incineration plants.
The zero pollution action plan includes targets for preventing and better managing waste through:
- significant reductions in waste generation by 2030;
- halving the amount of residual municipal waste in the EU by 2030.
Assessing key waste management trends
So far, the EU has managed to slow down waste generation — between 2010 and 2018, waste generation has increased more slowly than economic growth, leading to a relative decoupling of waste generation from economic growth (Figure 20). Between 2018 and 2020, waste generation in the EU registered a significant reduction of around 8%. However, this reduction follows a contraction of the EU economy in 2020, as a result of the measures put in place to contain the COVID-19 pandemic. Therefore, it is not yet safe to say that the goal of absolute decoupling — i.e. decreasing waste generation while growing the economy — has been achieved in the EU. Although the management of some waste streams is improving, around half of all waste has continued to be disposed of in landfill or incineration plants for the past 10 years.
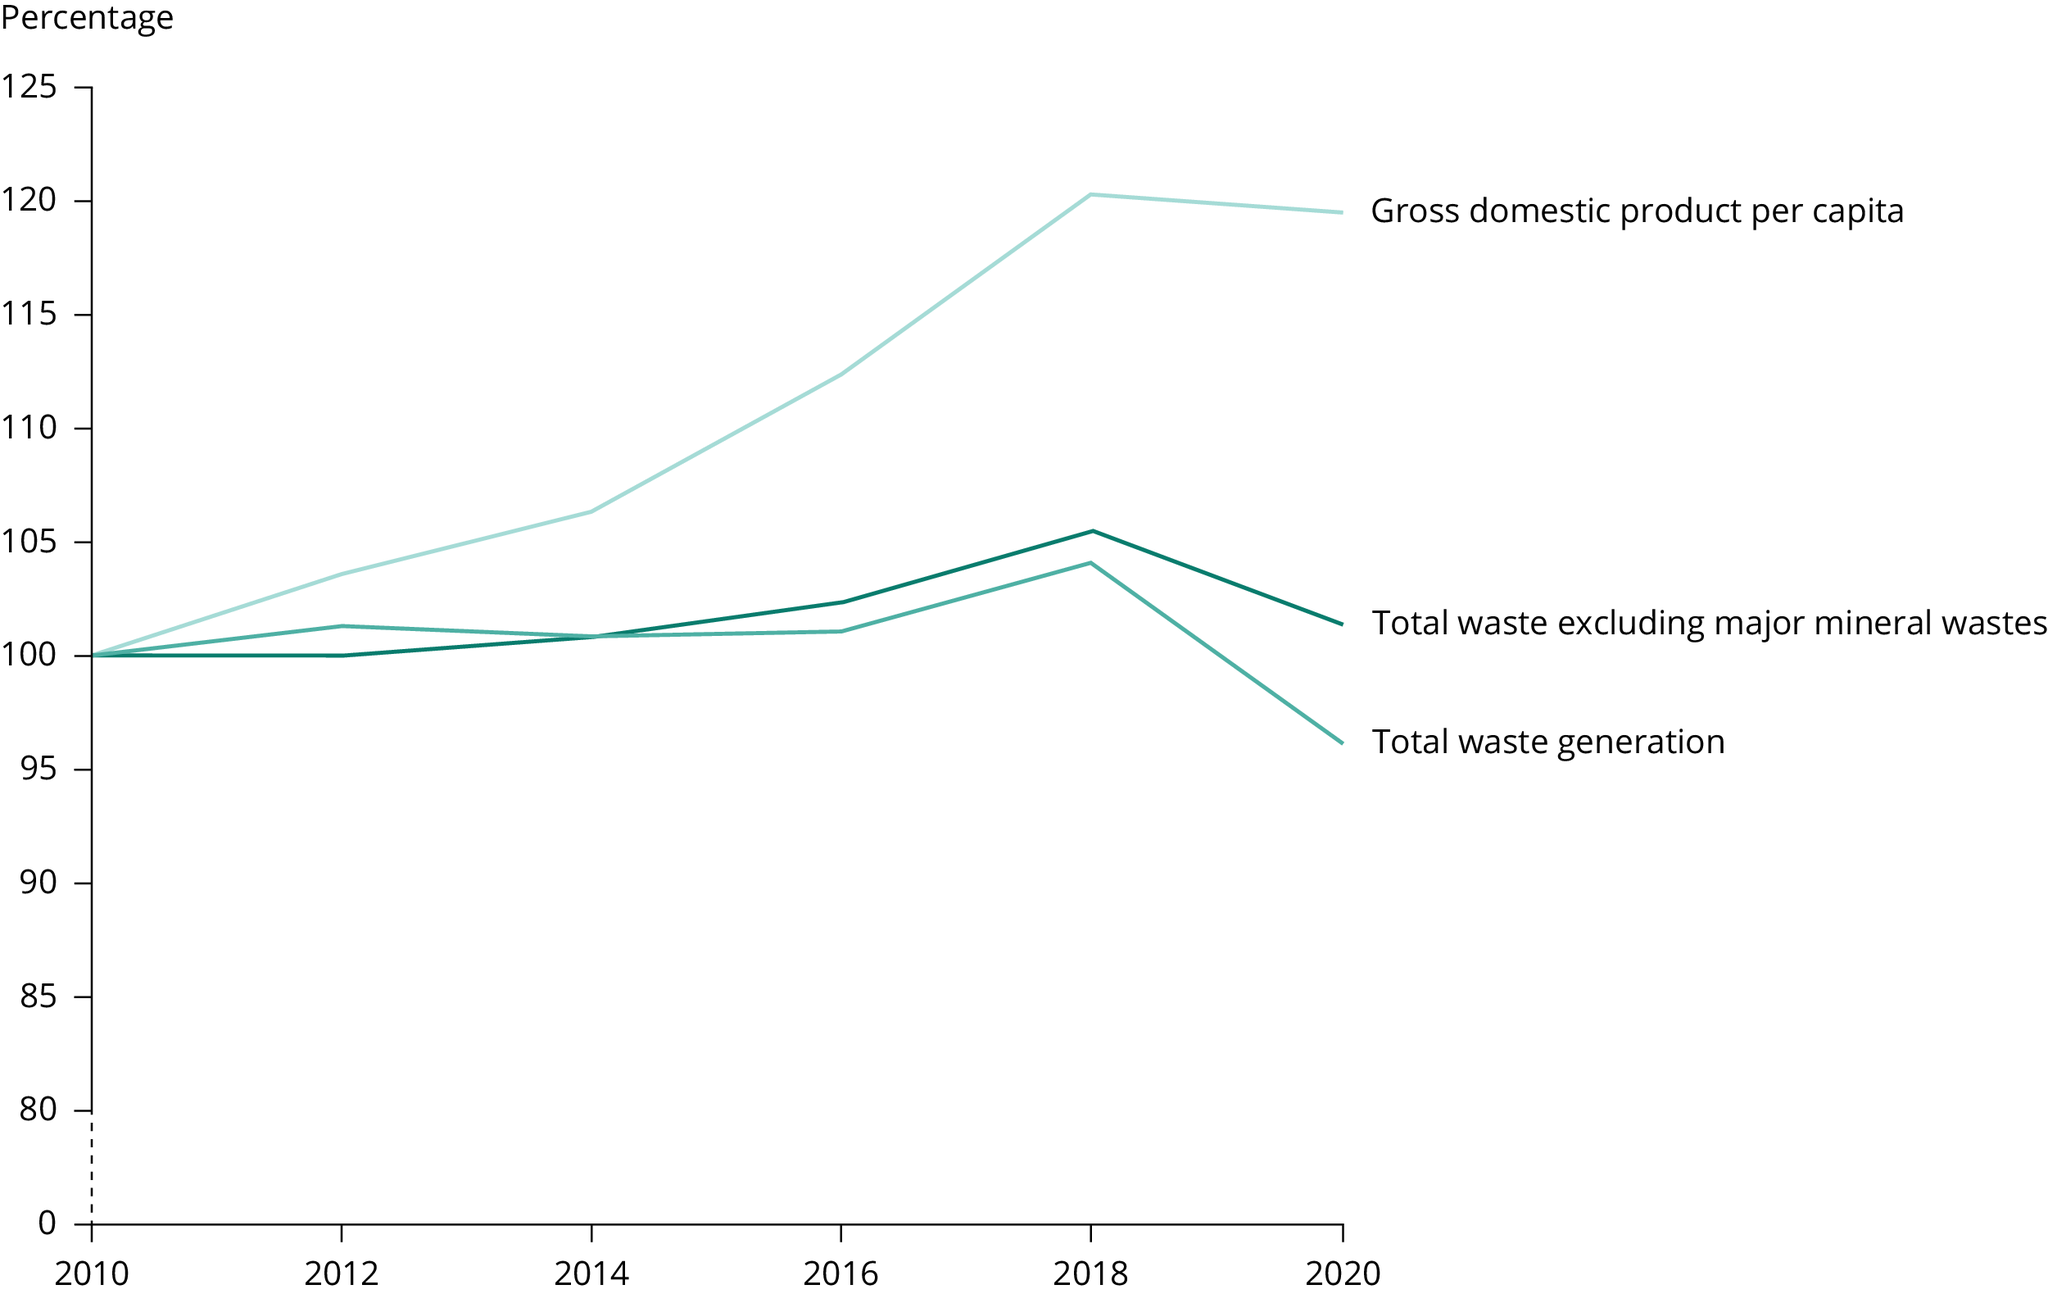
Note: GDP, gross domestic product.
Source: EEA (2021a); adapted from Eurostat.
Click here for different chart formats and data
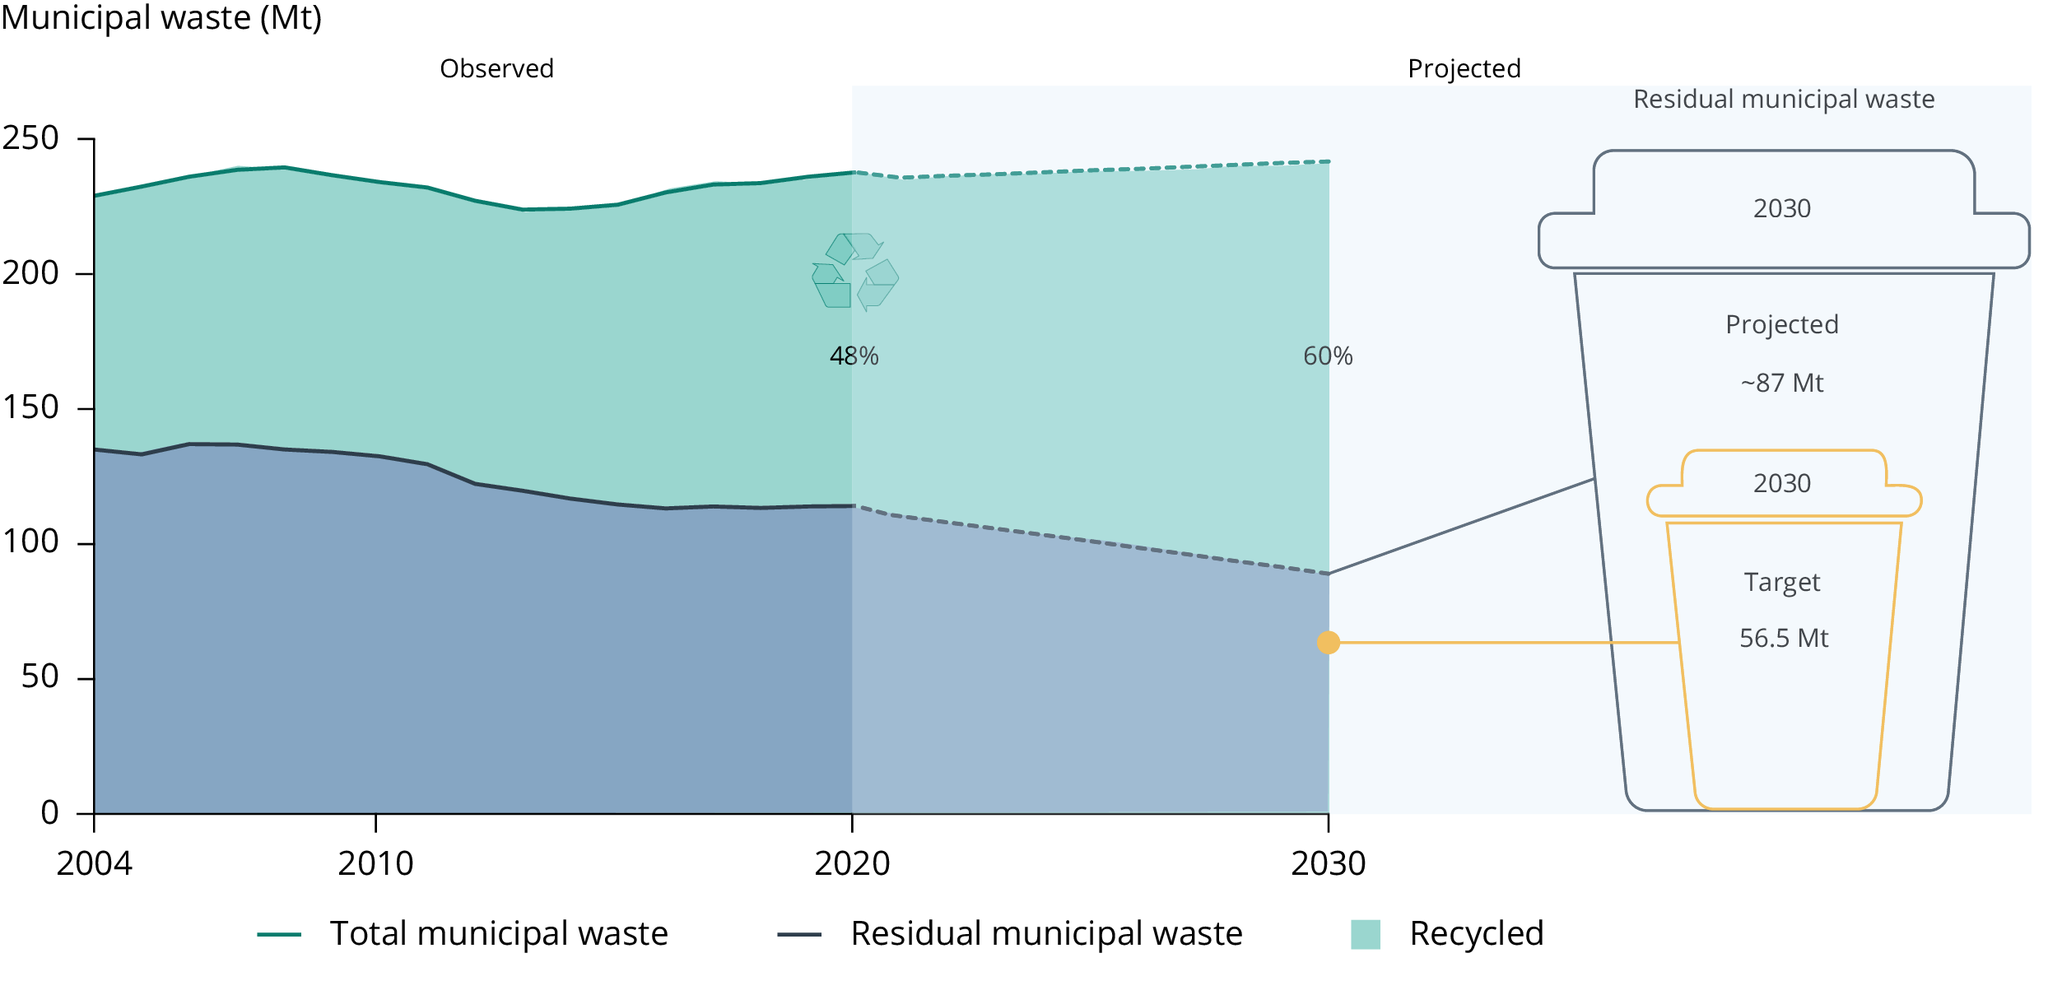
Figure 21 shows that the recycling of municipal waste steadily increased between 2004 and 2020, with a corresponding decrease in residual municipal waste. However, according to projections, the EU is unlikely to meet its target for residual municipal waste levels by 2030 — even if the recycling target for municipal waste (included in the EU Waste Framework Directive) is achieved by all EU Member States. The target to halve residual waste could only be reached through very intensive efforts to prevent municipal waste generation and achieve recycling levels that are higher than current EU targets.
Sending waste to landfill is considered one of the least favourable waste management options. It is associated with many forms of pollution; for instance, leaching of pollutants into groundwater, emissions of certain air pollutants such as methane and littering the marine environment. The amount of generated waste sent to landfills has been decreasing in the EU both in absolute terms and as a share of generated waste, as a result of past EU action. Between 2010 and 2020, the total quantity of waste (excluding major mineral wastes[1]) sent to landfill decreased from 173 million tonnes to 125 million tonnes and in 2020 only 16% of generated waste was landfilled (Figure 22).
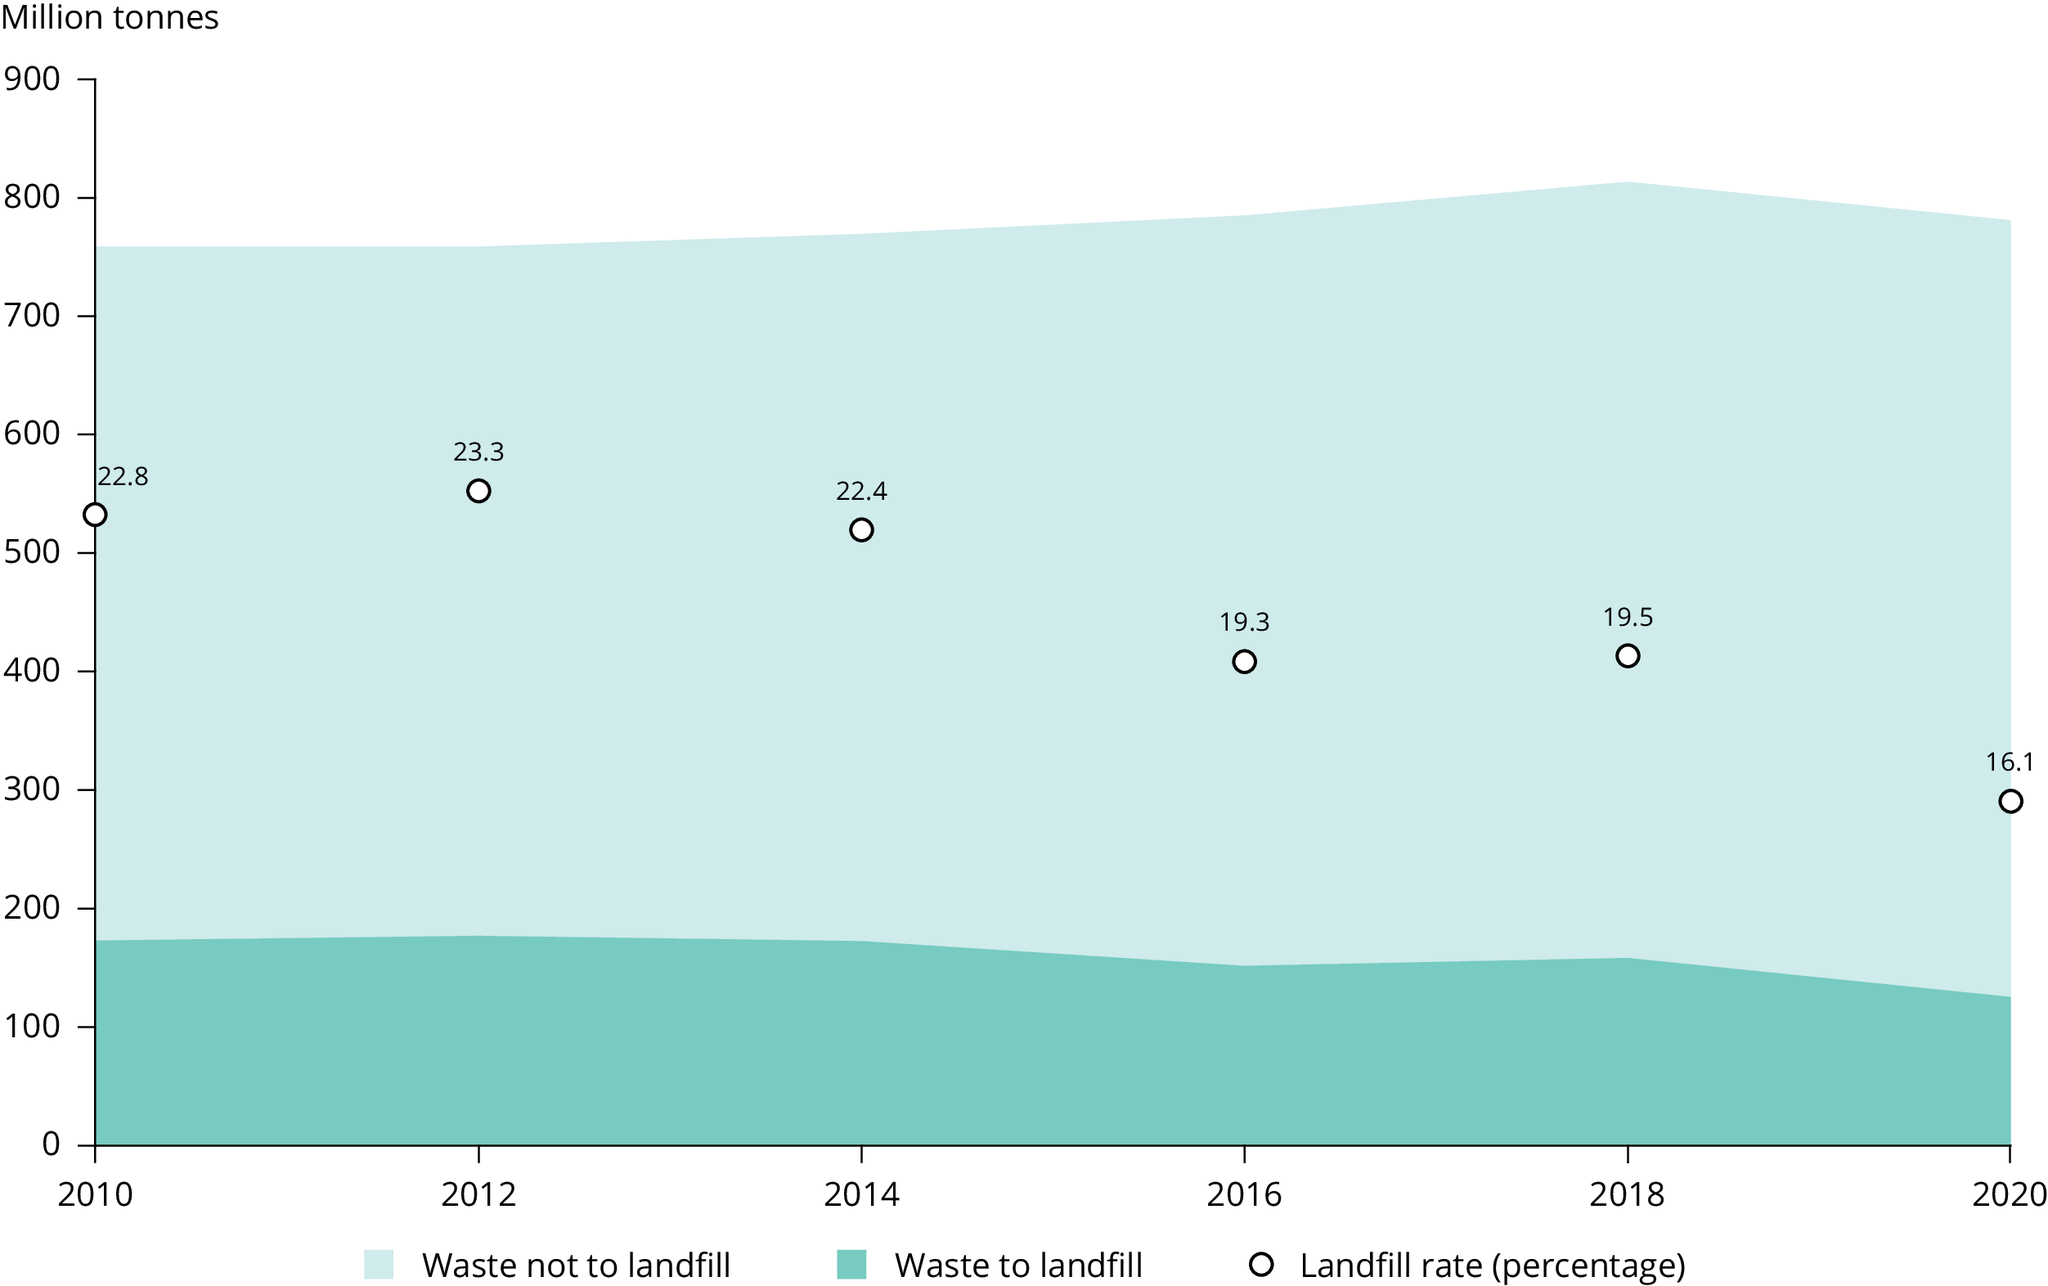
Source: EEA (2021b); adapted from Eurostat.
Click here for different chart formats and data
The amount of waste exported from the EU increased by 77% between 2004 and 2021. Waste exported outside the EU may not be treated in line with similarly strict pollution control requirements as in the EU, and therefore might be a significant source of pollution in third countries.
A current high-profile waste issue stems from the continuous growth in production, and the use of and trade in plastics in Europe and globally. Import bans on waste plastic in countries such as China have significantly reduced plastic waste exports from the EU (EEA, 2021c). Plastic is a significant fraction of total waste in Europe and, if mismanaged, has serious impacts (including the unknown long-term effects of microplastics on ecosystem quality and human health). A number of EU policies and initiatives have been put in place to address the problems posed by plastics, from introducing ambitious recycling targets to banning single-use items. However, plastic waste still remains and will remain a serious pollution issue, as further explained in the zero pollution cross-cutting story on plastics.
Pollution from waste landfill and waste incineration
Figure 23 indicates that methane emissions decreased steadily between 2010 and 2020; this was partially due to less food waste (a source of methane) being sent to landfill and emissions being better managed. Carbon dioxide emissions fluctuated somewhat and have increased slightly in recent years. Ammonia emissions increased during the period with somewhat erratic trends due to intermittent reporting by facilities and significant variations in the data received.
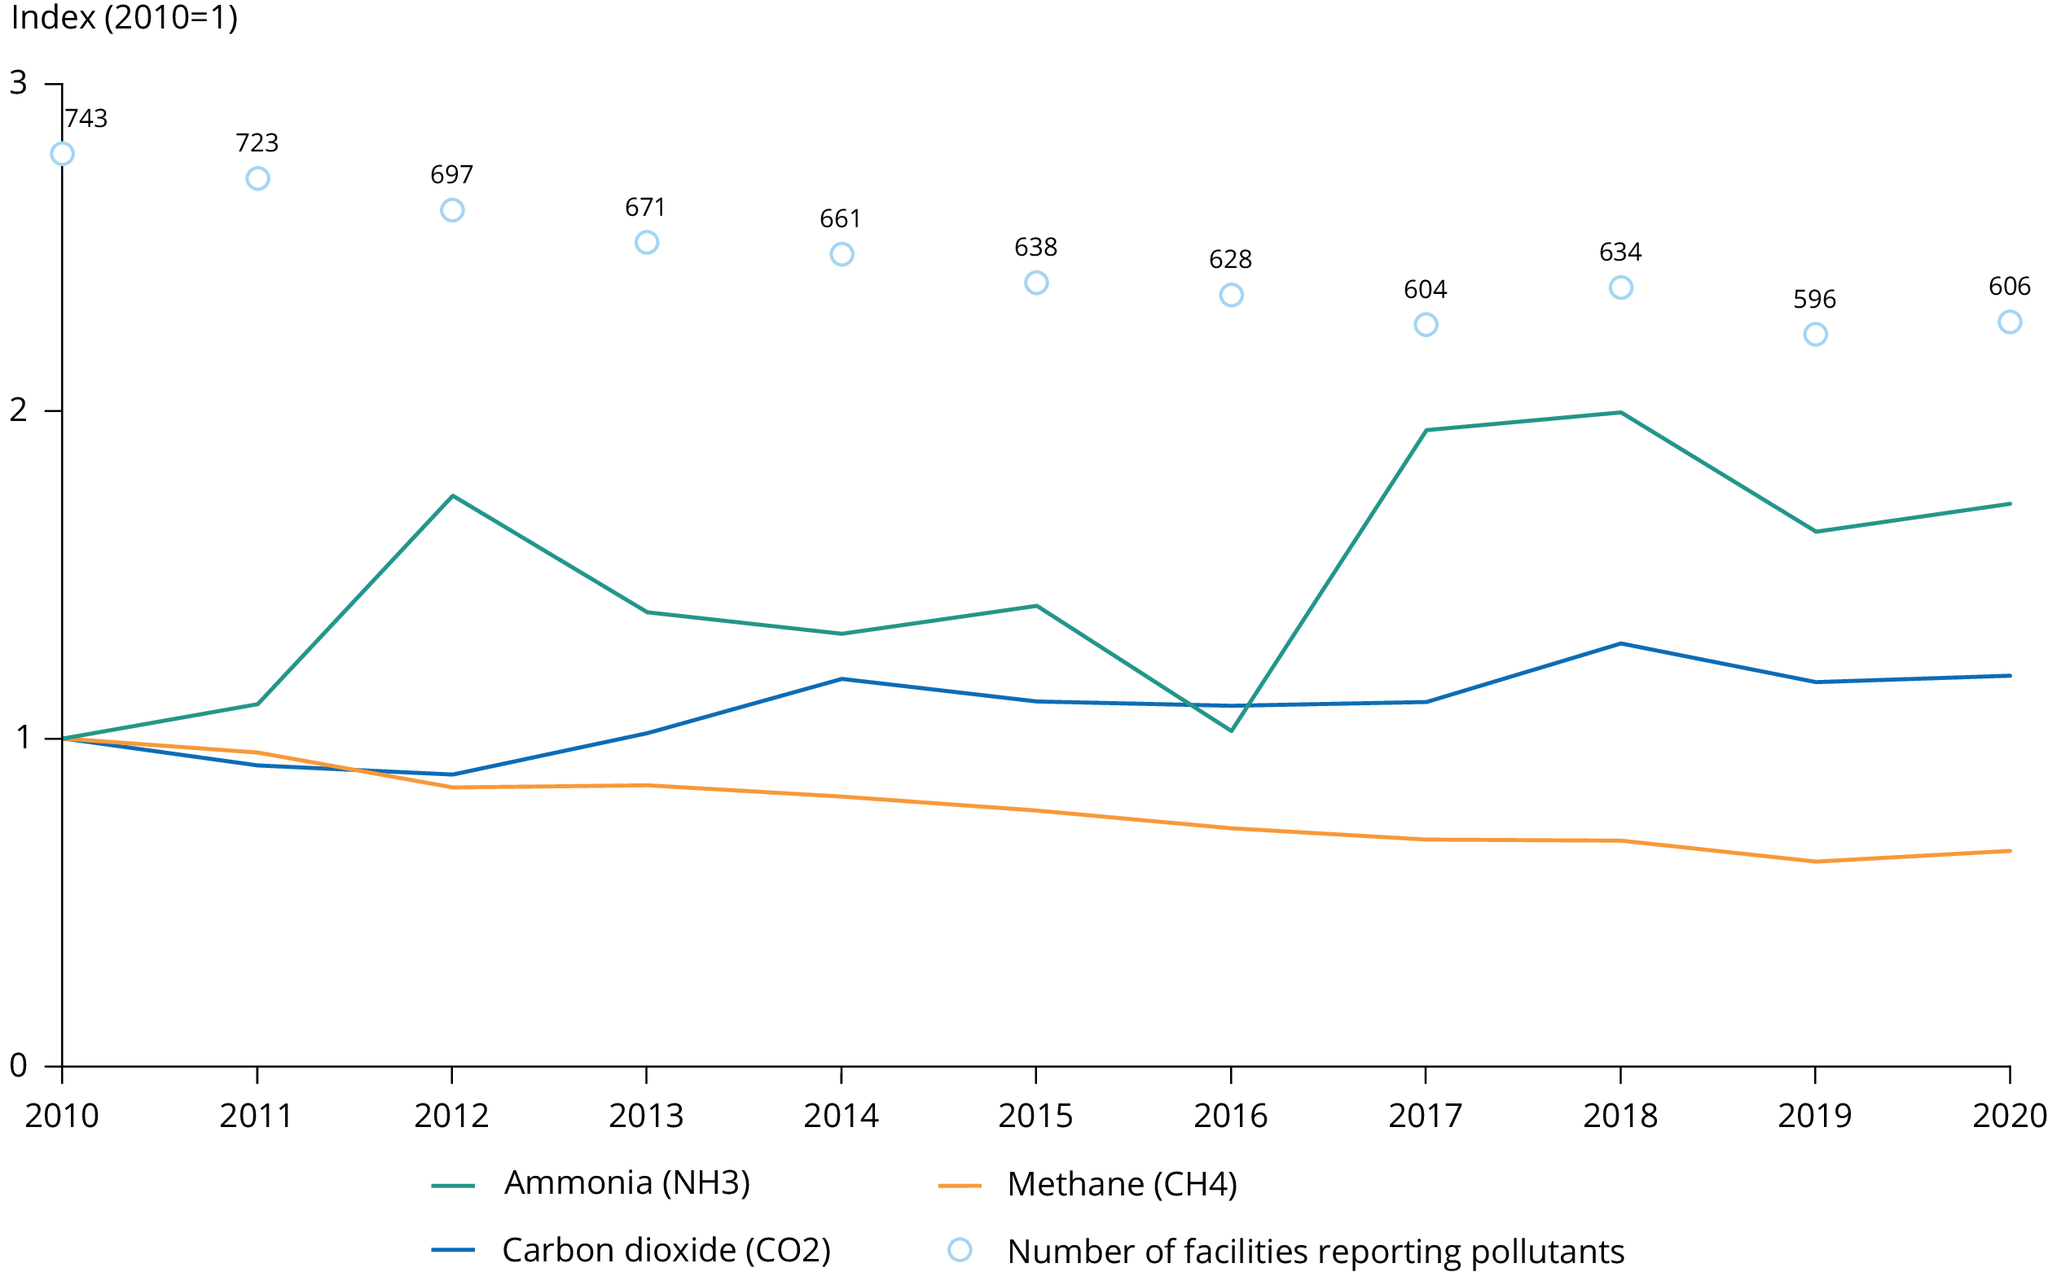
Note: An outlier removal and data cleaning exercise has been performed on the original officially reported data. In addition to pollutant emissions, the graph also shows the trend in the number of facilities reporting emissions data in this sector. The following activity is covered: 5d in Annex I to the European Pollutant Release and Transfer Register (E-PRTR) Regulation (‘Landfills (excluding landfills of inert waste and landfills which were closed before 16.7.2001 or for which the after-care phase required by the competent authorities according to Article 13 of the Landfill Directive; receiving 10 tonnes per day or with a total capacity of 25 000 tonnes’).
Source: Based on data reported to the European Industrial Emissions Portal (EEA, 2022b).
Click here for different chart formats and data
Figure 24 shows changes in air pollutant emissions from incineration facilities in Europe between 2010 and 2020. Although the pollutant emissions depicted are either increasing or show erratic trends, emissions from incineration plants are expected to decline if the best available technique reference documents (BREFs) for the sector are fully adopted and used as the basis for issuing environmental permits by late 2023. Moreover, the proposal for a new Industrial Emissions Directive (IED), if adopted, will help to reduce emissions further.
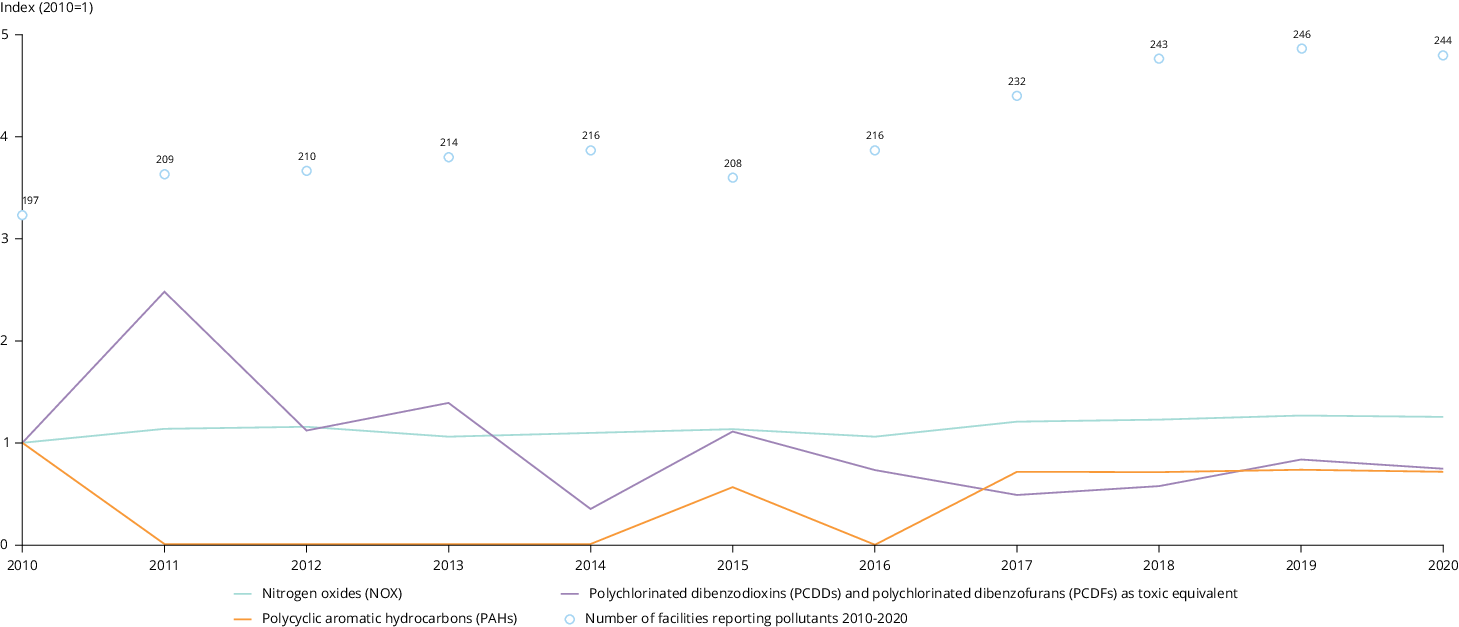
Note: An outlier removal and data cleaning exercise has been performed on the original officially-reported data. In addition to pollutant emissions, the graph also shows the trend in the number of facilities reporting emissions data in this sector. The indexed graph for dioxins and furans fluctuates sharply because of the small quantities reported by Member States, that is, these pollutants are emitted in such small quantities that small changes in absolute terms lead to sharp changes in the indexed graph. The following activity is covered: 5b in Annex I to the European Pollutant Release and Transfer Register (E-PRTR) Regulation (‘Installations for the incineration of non-hazardous waste in the scope of the IED; with a capacity of 3 tonnes per hour’). PAHs have been indexed to 2009 as a proxy because no PAH emissions were reported by this activity in 2010.
PCDD, polychlorinated dibenzodioxin; PCDF, polychlorinated dibenzofuran.
Source: Based on data reported to the European Industrial Emissions Portal (EEA, 2022b).
Click here for different chart formats and data
Note: Links to indicators: Waste generation and decoupling in Europe, Reaching 2030’s residual municipal waste target — why recycling is not enough, Diversion of waste from landfill in Europe.
Overview of indicator analysis methodology
This indicator analysis is in line with the approach taken by the EEA for its seventh environment action programme monitoring.
Past trends are based on assessment of the trend over the last 10 years (or since the relevant zero pollution baseline year where appropriate) with green, yellow or red being applied based on the criteria as outlined in the figure legend. Expert judgement is also applied, for example in cases where indicators are more qualitative and/or uncertain.
The distance to target is based on an assessment of the recent trend, current status and expert judgement.
Further detailed analysis of the future outlook for meeting certain zero pollution targets is included in the zero pollution outlook 2022, completed by the European Commission Joint Research Centre (JRC, 2022).
Notes
[1] Major mineral wastes, such as hard rocks, concrete, soils and others mainly produced in the mining and construction sectors, significantly outweigh other waste types. They also usually cause environmental issues of less concern.
References
EEA, 2021a, ‘Waste generation and decoupling in Europe’, European Environment Agency, (https://www.eea.europa.eu/ims/waste-generation-and-decoupling-in-europe) accessed 10 October 2022.
EEA, 2021b, ‘Diversion of waste from landfill in Europe’, European Environment Agency (https://www.eea.europa.eu/ims/diversion-of-waste-from-landfill) accessed 10 October 2022.
EEA, 2021c, ‘The plastic waste trade in the circular economy’, European Environment Agency (https://www.eea.europa.eu/publications/the-plastic-waste-trade-in) accessed 10 October 2022.
EEA, 2022a, ‘Observed total and residual municipal waste, together with total municipal waste generation under projection of increase of 3.7% until 2030, and equivalent residual waste generated in the 2030 target is reached’, European Environment Agency (https://www.eea.europa.eu/data-and-maps/figures/observed-total-and-municipal-residual) accessed 10 October 2022.
EEA, 2022b, ‘Industrial reporting under the Industrial Emissions Directive 2010/75/EU and European Pollutant Release and Transfer Register Regulation (EC) No 166/2006’, European Environment Agency (https://www.eea.europa.eu/data-and-maps/data/industrial-reporting-under-the-industrial-6) accessed 10 October 2022.
JRC, 2022, Zero pollution outlook 2022, JRC129655, Publications Office of the European Union, Luxembourg, Joint Research Centre (https://joint-research-centre.ec.europa.eu/zero-pollution-outlook-2022_en) accessed 1 December 2022.
Cover image source: © Mateo Puđa, Well with Nature /EEA

Document Actions
Share with others