next
previous
items

Figure

Observed total and municipal residual waste, together with total municipal waste generation under projection of increase of 3.7 % until 2030, and equivalent residual waste generated if the 2030 recycling target is reached

Figure Created 09 Mar 2022 Published 26 Apr 2022 Last modified 21 Apr 2022
1 min read
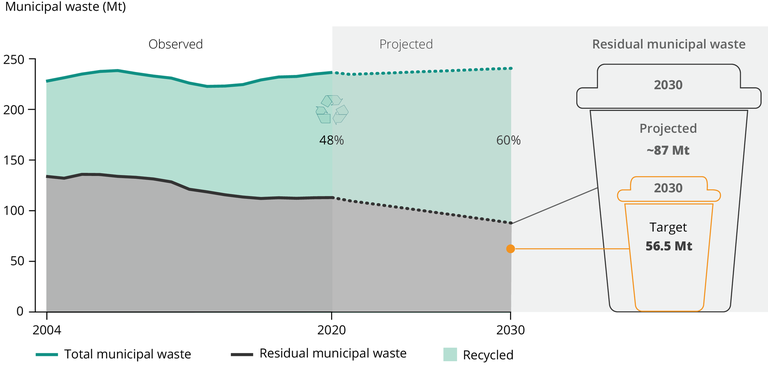
The chart puts together the trends (2004-2020) and projections (2020-2030) in both total and residual municipal waste for EU-27, for the case in which the 60 % recycling rate target of 2030 would be met. A comparison with the residual target allows for some insight on the distance of the projections to the actual target.

European data

Metadata

Additional information

There is no downloadable dataset for the "Scoping study to assess the feasibility of further EU measures on waste prevention: final report" (European Commission, Directorate-General for Environment, Karigl, B., Neubauer, C., Kral, U., et al., Scoping study to assess the feasibility of further EU measures on waste prevention : final report, 2022, https://data.europa.eu/doi/10.2779/21588). The European Commission report contains two different projections until 2035, and the current figure is based on the same annual increase for the upper-bound projection until 2030 as in the Commission report.

Permalinks

Geographic coverage

Temporal coverage

Topics

Document Actions