Policy context
In 2021, the World Health Organization (WHO) updated its air quality guidelines for the first time since 2005. This update is based on a systematic review of the latest scientific evidence outlining how air pollution affects human health.
For several decades, the European Union (EU) has had air quality standards in place for key air pollutants in the ambient air quality directives. If levels exceed these binding standards, Member States should prepare air quality plans to address the sources responsible and ensure compliance. Although these values were based on the 2005 WHO air quality guidelines, they also reflected the technical and economic feasibility of their attainment across EU Member States. The EU air quality standards are therefore less demanding than the 2005 WHO air quality guidelines.
Under the European Green Deal’s zero pollution action plan, the European Commission set the goal to reduce the number of premature deaths caused by PM2.5 by at least 55% by 2030, compared to 2005. In 2020, the European Commission initiated a revision of the ambient air quality directives, aiming to align the air quality standards more closely with the WHO recommendations. The revision also aims to strengthen provisions on air quality monitoring and modelling, and on the development of air quality plans to help local authorities achieve cleaner air. In parallel, stricter requirements are also foreseen under the European Green Deal to tackle air pollution at source, such as from agriculture, industry, transport, buildings and energy. A proposal for a revised Ambient Air Quality Directive was adopted on 26 October 2022.
This chapter provides estimates of the health impacts resulting from exposure to fine particulate matter, nitrogen dioxide and ozone – both in terms of mortality and morbidity. It is the first time that EEA uses for these estimations the updated recommendations for mortality set out in the 2021 WHO global air quality guidelines. It also assesses progress towards the zero pollution action plan target of reducing the health impacts of air pollution by more than 55% by 2030.
Measuring the burden of disease
Mortality refers to the number of deaths that have occurred because of a specific disease or a group of diseases. Mortality is expressed either as premature deaths or years of life lost.
Premature deaths are deaths that occur before a person reaches an expected age. This expected age is typically the life expectancy for a country, stratified by sex and age. Premature deaths are considered preventable if their cause can be eliminated.
Years of life lost (YLL) is defined as the years of potential life lost because of premature death. YLL is an estimate of the number of years that people in a population would have lived had there been no premature deaths. The YLL measure considers the age at which deaths occur; therefore, the contribution to the total number of lost life years is higher for a premature death occurring at a younger age and lower for a premature death occurring at an older age.
Morbidity is the state of having a disease, measured by, for instance, the prevalence of a disease in a population. In this briefing, morbidity is expressed as years lived with disability (YLD), meaning years of healthy life lost to disability.
A
Disability-Adjusted Life Year (DALY) is one lost year of a 'healthy' life because of a disease, injury or risk factor. DALYs are obtained by combining YLL and YLDs for the same disease or group of diseases. The burden of disease is the sum of these DALYs across the population. Therefore, DALYs standardise health effects by expressing, in one number, the number of people affected and the duration and severity of the health effects.
Progress towards the zero pollution action plan target related to the health impacts of air pollution
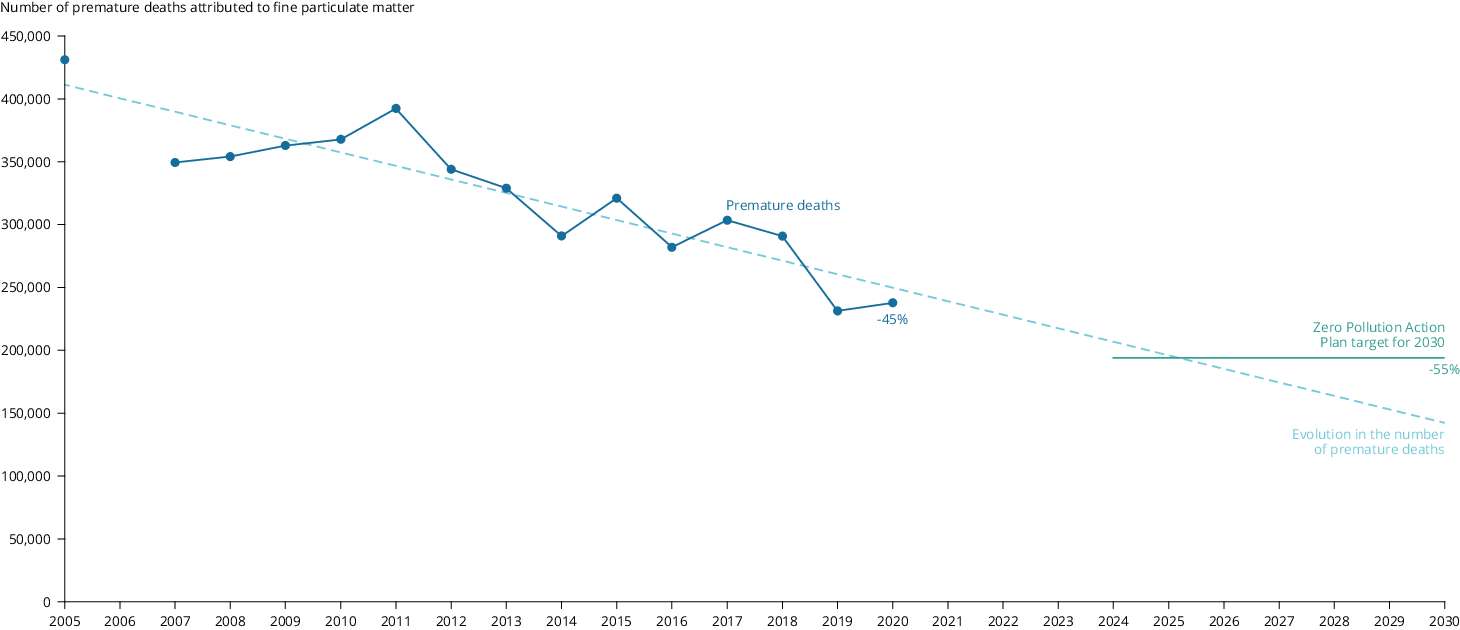
The Zero Pollution Action Plan sets the 2030 target of improving air quality, with a focus on PM2.5, in order to reduce the number of premature deaths caused by air pollution in the EU by a minimum of 55%, relative to those in 2005.
Having a look at the past trend, from 2005 to 2020, premature deaths in the EU attributable to PM2.5 exposure above the WHO guideline level fell by 45% (see Figure 1). Should air quality continue to improve at this rate and the number of premature deaths continue to fall at a comparable rate in the future, the target would be achieved by 2026. However, this estimation is based purely on the assumption that the observed trend will continue. It is not a projection, since it does not factor in any recent policy developments or additional efforts taken to improve air quality since 2020.
Figure 1. Premature deaths in the EU-27 due to PM2.5 levels above the 2021 WHO guidelines and distance to the zero pollution target, 2005-2020
Note: To estimate premature deaths, all-cause (natural) mortality is considered in people over 30 for concentrations above the 2021 WHO guideline level of 5 µg/m3, assuming a linear increase in the risk of mortality of 8% for a 10 μg/m3 increase in concentrations of PM2.5. The evolution in the number of premature deaths is based on the continuation of the past rate of reduction in premature deaths.
Source: ETC/EH, 2022a
Click here for different chart formats and data
Continuously reducing particulate matter concentrations in ambient air over the next decade will be challenging. To meet the target, Member States will need to fully implement their national air pollution control programmes (NACPCs), as well as measures needed to reach the 2030 climate and energy targets (European Commission, 2021).
In terms of exposure, an increasingly ageing and urbanising European population counteracts some of the health gains associated with the reduction in ambient air pollution concentrations. Firstly, older people are more sensitive to air pollution. Secondly, a higher rate of urbanisation typically means that more people are exposed to PM2.5 concentrations, which tend to be higher in cities.
The WHO air quality guidelines refer to concentrations of key air pollutants above which adverse health effects are known to occur. They offer quantitative, health-based recommendations for air quality management and provide an evidence-based tool for policy makers working on air quality. The WHO air quality guidelines also include ‘interim targets’ — levels associated with a qualified reduction in the risk to health — that inform the development of pollution reduction policies that are achievable in realistic timeframes in highly polluted areas. WHO recommends that ‘the interim targets be regarded as steps towards the ultimate achievement of air quality guideline levels in the future, rather than as an end target’.
Estimating the health impacts of air pollution
Since 2014, the EEA has been estimating mortality due to exposure to air pollution, with support from our European Topic Centres. Mortality is the most serious health outcome of exposure to air pollution, with robust scientific evidence of causality and for which data are more widely available. At the same time, studies increasingly show that ambient air pollution is also associated with morbidity due to several chronic conditions, such as diabetes or chronic obstructive pulmonary disease (GBD, 2019). As a result, the share of morbidity in the total burden of disease for selected diseases is considerable.
Concentration-response functions are used to attribute a health risk to exposure to air pollution. These functions are based on epidemiological studies and estimate the increase in risk per unit of concentration of a certain air pollutant. As an example, the concentration-response function for mortality from exposure to PM2.5 used in this briefing assumes a linear increase in the relative risk of mortality of 8% per 10 µg/m3 increase in the annual mean concentration of PM2.5 (as recommended in (WHO, 2021)).
So far, the EEA used the concentration-response functions for mortality recommended by WHO in their 2013 report on the health risks of air pollution in Europe. In this briefing, EEA applies for the first time the concentration-response functions for mortality set out in the 2021 WHO air quality guidelines. For both PM2.5 and O3 the risk of mortality associated with incremental increases in concentrations is now higher, while for NO2 the associated risk is slightly lower. An increased risk of mortality will increase the estimates of premature deaths per unit of air pollution, while a decreased risk will do the opposite.
An additional change to the method of calculating mortality has to do with the range of concentrations considered. Until 2021 and based on the 2013 WHO recommendations, all concentrations were considered for PM2.5; only concentrations above 20 µg/m3 were considered for NO2 and only concentrations above 70 µg/m3 for O3. Following the 2021 WHO air quality guidelines, the main analysis presented in this briefing calculated mortality for concentrations above 5 μg/m3 for PM2.5 and above 10 μg/m3 for NO2. These values correspond to the new air quality guideline levels, below which the level of uncertainty surrounding the concentration-response functions is higher. This change reduces premature death estimates, since health impacts below the WHO guideline levels are not accounted for (although they are considered in a sensitivity analysis). Regarding O3, the concentration from which premature deaths are calculated remains unchanged at 70 µg/m3.
Note that the estimates of premature deaths presented here may differ from others calculated at national and European levels due to differences in methodological choices. As an example, the estimated number of premature deaths presented in this assessment is higher than those presented in the Study to support the impact assessment for a revision of the EU Ambient Air Quality Directives (Birchby et al., 2022). The kinds of methodological choices that can affect estimates of premature deaths include:
- The use of different concentration maps, where concentrations are estimated at different scales;
- The use of more detailed demographic data. For instance, the EEA assumes a unique national value of mortality, while countries might have specific regional or local data;
- The use of different relative risks;
- The use of different assumptions in the range of concentrations considered. For example, the main analysis carried out by the EEA for PM2.5 considers concentrations above the 2021 WHO guideline level (5 µg/m3), while a sensitivity analysis has considered all the range of concentrations, that is, above 0 µg/m3. Some countries might use another concentration; for instance, half of the 2021 WHO guideline level, or 2.5 µg/m3 .
The EEA uses concentration maps with the same resolution and applies the same assumptions for all of Europe, enabling a robust comparison across European countries.
For morbidity, years lived with disability (YLD) were estimated for ten pollutant-disease pairs. For these pairs, scientific evidence of an association between exposure to a specific air pollutant and the disease is robust and enough data for the estimations were available. Morbidity was calculated for the European countries for which health data was also available. The number of countries varied between 23 and 35, depending on the disease. For PM2.5, morbidity was estimated for:
- asthma in children;
- chronic obstructive pulmonary disease;
- ischemic heart disease;
- lung cancer;
- diabetes mellitus;
- and stroke.
For NO2, morbidity was estimated for:
- asthma in adults;
- diabetes mellitus;
- and stroke.
For O3, estimates were calculated for the number of hospital admissions due to respiratory diseases.
How air pollution impacted health in Europe in 2020
Mortality
In 2020 in the EU-27:
- 238,000 premature deaths were attributable to exposure to PM2.5 concentrations above the WHO guideline level of 5 µg/m3;
- 49,000 premature deaths were attributable to exposure to NO2 concentrations above the WHO guideline level of 10 µg/m3;
- 24,000 premature deaths were attributable to acute exposure to O3 concentrations above 70 µg/m3.
In 2020 in Europe (please see the countries considered in tables 2 and 3):
- 275,000 premature deaths were attributable to exposure to PM2.5 concentrations above the WHO guideline level of 5 µg/m3;
- 64,000 premature deaths were attributable to exposure to NO2 concentrations above the WHO guideline level of 10 µg/m3;
- 28,000 premature deaths were attributable to acute exposure to O3 concentrations above 70 µg/m3.
SENSITIVITY ANALYSIS OF PREMATURE DEATHS DUE TO AIR POLLUTION
It is important to note that the numbers of premature deaths presented here do not capture possible additional deaths caused by exposure to PM2.5 and NO2 concentrations below the respective 2021 WHO guideline levels (for which the scientific evidence is less certain than for health impacts above the WHO guideline levels). Furthermore, there is no evidence of a threshold below which air pollution does not impact health. With this in mind, EEA has also performed a sensitivity analysis of premature deaths for exposure to PM2.5 and NO2 at concentrations above 0 µg/m3. For O3, premature deaths were calculated for exposure to concentrations above 20 µg/m3. This enables comparison with results in previous EEA assessments on the impact of air pollution on health (where the old methodology was used). The level of uncertainty around these estimates is higher than for the estimates of health impacts presented above.
Table 1 presents the potential additional premature deaths and potential total premature deaths by pollutant for the EU-27 and for the larger number of European countries included in the assessment.
The EEA table Air Quality Health Risk Assessments presents, for all considered countries and the different aggregations, the estimates from 2005 to 2020 of the premature deaths attributable to exposure to PM2.5, NO2 and O3 . It takes into account the methodology used until last year, the current methodology and the one used for the sensitivity analysis.
Table 1. Potential additional premature deaths and potential total premature deaths in 2020 when lower concentrations of key pollutants are considered
Static Content listing
| Geographical scope | Pollutant | Additional premature deaths | Total premature deaths |
|---|
| EU - 27 |
PM2.5 |
174,000 |
412,000 |
| NO2 |
87,000 |
136,000 |
| O3 |
83,000 |
107,000 |
| 40 European countries |
PM2.5 |
188,000 |
463,000 |
| 41 European countries |
NO2 |
102,000 |
166,000 |
| O3 |
96,000 |
124,000 |
Table 2 presents the total country population, the population-weighted mean concentrations and the estimated number of attributable premature deaths by country in 2020.
Table 3 presents the YLL and YLL per 100,000 inhabitants associated with exposure to PM2.5, NO2 and O3 concentration levels in 2020.
When comparing 2020 to 2019, the number of premature deaths attributable to air pollution increased for PM2.5 but decreased for NO2 and O3. Apart from the changes in concentrations and demographics, the number of premature deaths was also influenced by the COVID-19 pandemic. COVID-19 incremented the number of natural deaths in 2020. For PM2.5, falls in concentrations were counteracted by an increase in deaths due to the pandemic. In the case of NO2, significant falls in concentrations were seen as a direct result of reductions in road transport during COVID-19 lockdowns (EEA, 2022). The impact lower concentrations had in terms of reducing mortality countered the excess deaths due to COVID-19.
The sections below provide information at country level on the health impacts of key pollutants
For PM2.5, the highest absolute numbers of premature deaths in 2020 were seen in Italy, Poland, Germany, Romania and Spain, in order of decreasing rank.
When considering YLL per 100,000 inhabitants, the highest relative numbers were observed in central and eastern European countries. This is where the highest concentrations of PM2.5 were also observed; namely, in Bosnia and Herzegovina, Serbia, Kosovo, North Macedonia and Bulgaria, in order of decreasing rank.
The lowest relative health impacts due to PM2.5 exposure were seen in countries situated in the north and north-west of Europe, including Iceland, Finland, Norway, Sweden and Estonia.
For NO2, the highest absolute numbers of premature deaths in 2020 were seen in Türkiye, Italy, Germany, Spain and France, in order of decreasing rank.
When considering YLL per 100,000 inhabitants, the highest relative numbers were observed in Bulgaria, Türkiye, Romania, Greece and Serbia, in order of decreasing rank.
The lowest relative health impacts due to NO2 exposure were seen in Estonia, Iceland, Finland, Sweden and Denmark.
The countries with the highest absolute numbers of premature deaths in 2020 due to exposure to O3 were Italy, Germany, France, Spain and Türkiye, in order of decreasing rank.
The countries with the highest rates of YLL per 100,000 inhabitants were Albania, Montenegro, Greece, Bosnia and Herzegovina and North Macedonia, in order of decreasing rank.
The countries with the lowest relative impacts were Iceland, Finland, Ireland, Norway and Sweden.
Morbidity
The following section presents estimates of morbidity for the diseases that entail the most significant health burden; namely, chronic obstructive pulmonary disease for PM2.5 and diabetes mellitus (also known as Type 2 diabetes) for NO2. For O3, the number of hospital admissions due to respiratory disease in adults aged 65 was used as a proxy for morbidity.
These results are based on the ETC/HE report. Estimating the morbidity related environmental burden of disease due to exposure to PM2.5, NO2 and O3 in outdoor ambient air (ETC/EH, 2022b). It estimated the morbidity associated with ten pollutant-disease pairs in 2019. For these pairs, the scientific evidence of an association between exposure to a specific air pollutant and the disease is robust and enough health data for the calculations were available.
In 2019, the morbidity effects of chronic obstructive pulmonary disease in adults aged 25 and above resulting from exposure to PM2.5 in 30 European countries was estimated at 175,702 YLD.
The highest absolute burden was seen in Germany with 38,460 YLDs; in contrast, the lowest was in Iceland with less than 10 YLDs. When accounting for population, the highest rates were seen in Serbia (90 YLD per 100,000 inhabitants), Lithuania (85 YLD per 100,000 inhabitants) and Croatia (81 YLD per 100,000 in habitants). The lowest rates were seen in Estonia, Finland, Sweden and Iceland (see Figure 2).
Click here for different chart formats and data
In 2019, the morbidity effects of diabetes mellitus in adults aged 35 and above resulting from exposure to NO2 in 31 European countries was estimated at 175,070 YLDs.
The highest absolute burden from diabetes mellitus was seen in Türkiye, with 54,186 YLDs. The lowest was in Iceland with 18 YLDs. When accounting for population, the highest rates were seen in Türkiye (146 YLDs per 100,000 inhabitants), Cyprus (76 YLDs per 100,000 inhabitants) and Greece (61 YLDs per 100,000 inhabitants). The lowest rates were seen in Estonia, Sweden and Denmark (see Figure 3).
Click here for different chart formats and data
For O3, the number of hospital admissions due to respiratory disease in adults aged 65 and above was used as a proxy for morbidity (since no study was identified linking the incidence or prevalence of diseases to exposure to O3). In 2019, a total of 12,253 hospital admissions were attributable to exposure to O3 across 23 European countries.
The highest absolute number of hospital admissions was estimated for Italy (3,059) and the lowest number for Iceland (<10). The highest numbers of hospital admissions by population attributable to exposure to O3 were seen in Austria (29 per 100,000 inhabitants), Spain (28 per 100,000 inhabitants) and Italy (22 per 100,000 inhabitants). The lowest rates were observed for Iceland, Latvia and the Netherlands (Figure 4).
Click here for different chart formats and data
The analysis in this chapter refers to the 27 Member States of the European Union (EU-27) as well as additional European countries, reaching a total of 41 countries.
Türkiye is not included in the PM2.5 estimations, leaving 40 countries considered for fine particles.
The health risk qualifications are done individually for the respective air pollutants. They cannot be added together as they exhibit some degree of correlation. This is the case for both mortality, and morbidity in terms of diabetes and stroke, due to fine particles and NO2.

Document Actions
Share with others