All official European Union website addresses are in the europa.eu domain.
See all EU institutions and bodiesAn official website of the European Union | How do you know?
Environmental information systems
EN
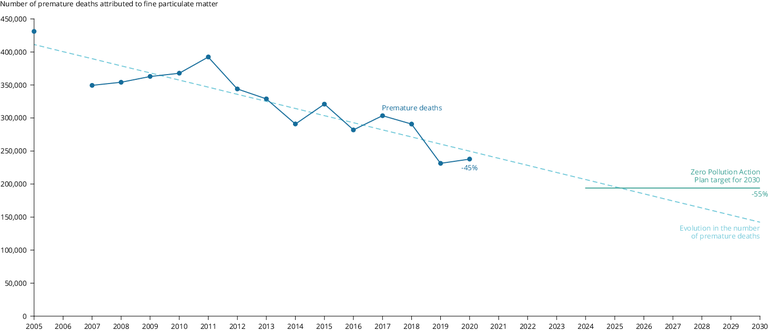
The figure shows the premature deaths attributed to long-term exposure to PM2.5 above the 2021 World Health Organization (WHO) guideline level in EU-27 in the period 2005-2020. The linear trend of that time series and the estimated year by which the Zero Pollution Action Plan (ZPAP) target (by 2030, minimum 55% reduction of the premature deaths occurred in 2005) would be met if the premature deaths are reduced following that linear trend.
Loading