Despite significant reductions in nitrogen emissions in Europe over the last three decades, eutrophication remains an environmental concern in the Baltic Sea basin. The waterborne input of nitrogen (mainly through river inflow) generally outweighs its airborne deposition; however, the latter occurs at the surface, where phytoplankton activity is greatest, and therefore particularly encourages plankton growth. Atmospheric nitrogen deposition remains a significant issue in the Baltic Sea.
Reducing atmospheric nitrogen deposition will be key to bringing the Baltic Sea’s total nitrogen levels under the maximum allowable input, a threshold set by the Baltic Marine Environment Protection Commission (Helcom).
Trends and main sectors contributing to airborne nitrogen deposition
Between 2000 and 2020, ammonia and nitrogen oxide emissions in the EU-27 decreased by 13% and 52%, respectively (EEA, 2022). Airborne nitrogen deposition to the Baltic Sea also decreased during the same general period, by around 25% (Gauss et al., 2021).
In 2020, agriculture accounted for 94% of ammonia emissions, while the main sources of nitrogen oxide emissions were transport (43%), agriculture (19%) and the energy sector (14%) (EEA, 2022).
Figure 1 presents the top five countries contributing to oxidised nitrogen deposition in 2017, with inputs presented as absolute values and shares of total deposition to each individual sub-basin. As expected, there are large differences between sub-basins, mainly caused by their different areas and locations relative to the major emission sources.
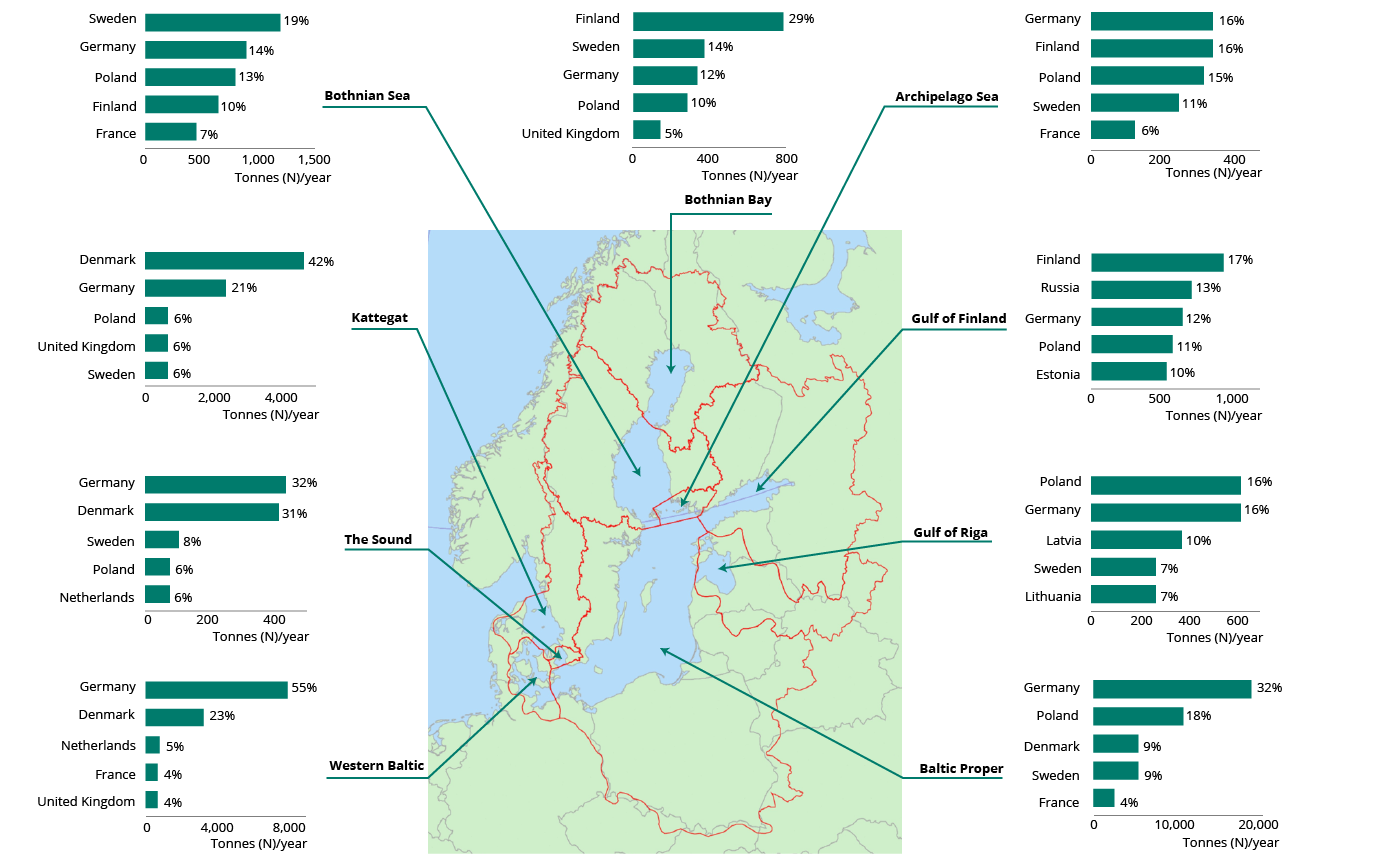
Note: The absolute values of oxidised nitrogen deposition are in tonnes(N) yr−1. Each country’s percentage of total deposition of oxidised nitrogen to the respective sub-basin is also provided.
Source: Gauss et al. (2021).
Click here to view the figure enlarged
Overall, three Member States (Germany, Poland and Denmark) are the main contributors to nitrogen deposition to the Baltic Sea, with agriculture and transport being the main sources. Agriculture in Germany was the single most important contributor, accounting for about 15% of the total (Gauss et al., 2021).
Impacts of eutrophication
Intensive algal blooms have become increasingly frequent in recent years as a result of a combination of excess nutrients and the increase in temperature in Baltic and Finnish coastal waters. In the Baltic Sea, there are two annual blooms: the spring bloom and the cyanobacterial bloom in late summer. In the southern Baltic Sea, autumnal blooms occur regularly. Additionally, exceptional blooms can occur locally (European Space Agency, 2022).
Massive algal and cyanobacterial blooms, caused by excess nutrients, can lead to ‘dead zones’ — areas where oxygen levels are too low for marine organisms to live. To combat this, Helcom recommends total maximum input limits for nitrogen. These limits clarify the maximum nitrogen level that the Baltic Sea sub-basins specifically can absorb; the target is 792,000 tonnes of nitrogen per year (Helcom, 2013).
Algal blooms along the Baltic coast also result in significant losses for the aquaculture industry. Summer cyanobacterial blooms in the Baltic Sea create foul bathing water and poor-quality beaches. This has an impact on tourism and raises health concerns, as some cyanobacteria produce toxins (Karlson et al., 2021).
References
EEA, 2022, ‘Air pollutant emissions data viewer (Gothenburg Protocol, LRTAP Convention) 1990-2020’, European Environment Agency (https://www.eea.europa.eu/data-and-maps/dashboards/air-pollutant-emissions-data-viewer-4) accessed 11 October 2022.
European Space Agency, 2022, ‘Algal bloom in the Baltic Sea’ (https://earth.esa.int/web/earth-watching/image-of-the-week/content/-/article/algal-bloom-in-the-baltic-sea/#:~:text=Algal%20bloom%20in%20the%20Baltic%20Sea%20An%20algal,occur%20in%20freshwater%20as%20well%20as%20marine%20environments) accessed 11 October 2022.
Gauss, M., et al., 2021, ‘Airborne nitrogen deposition to the Baltic Sea: past trends, source allocation and future projections’, Atmospheric Environment253, 118377 (https://doi.org/10.1016/j.atmosenv.2021.118377).
Helcom, 2013, HELCOM Copenhagen Ministerial Declaration: taking further action to implement the Baltic Sea Action Plan — reaching good environmental status for a healthy Baltic Sea (https://www.helcom.fi/wp-content/uploads/2019/08/2013-Copenhagen-Ministerial-Declaration-w-cover-1.pdf#:~:text=Declaration%20of%20the%20Ministers%20of%20the%20Environment%20of,of%20the%20Helsinki%20Commission%2C%20on%203%20October%202013) accessed 18 October 2022.
Karlson, B., et al., 2021, ’Harmful algal blooms and their effects in coastal seas of Northern Europe’, Harmful Algae 102, 101989 (https://doi.org/10.1016/j.hal.2021.101989).

Document Actions
Share with others