Key messages
- Water pollution levels decreased between the 1990s and 2010s. However, much of this progress has since halted. Unless further progress is made over the coming years, there is significant risk that relevant zero pollution targets will not be met.
- 58% of reported surface waters in Europe have not achieved good ecological status as of 2016, mostly as a result of pollution. Moreover, only 42% of surface water bodies achieve good chemical status. More positively, 77% of Europe’s groundwater areas have achieved good chemical status.
- There is a lack of information on several emerging chemical risks from pollutants, such as per- and polyfluoroalkyl substances (PFAS) in European waters. Further knowledge is needed to assess their occurrence and impacts, and identify appropriate interventions.
Guidance for reading the summary analysis:
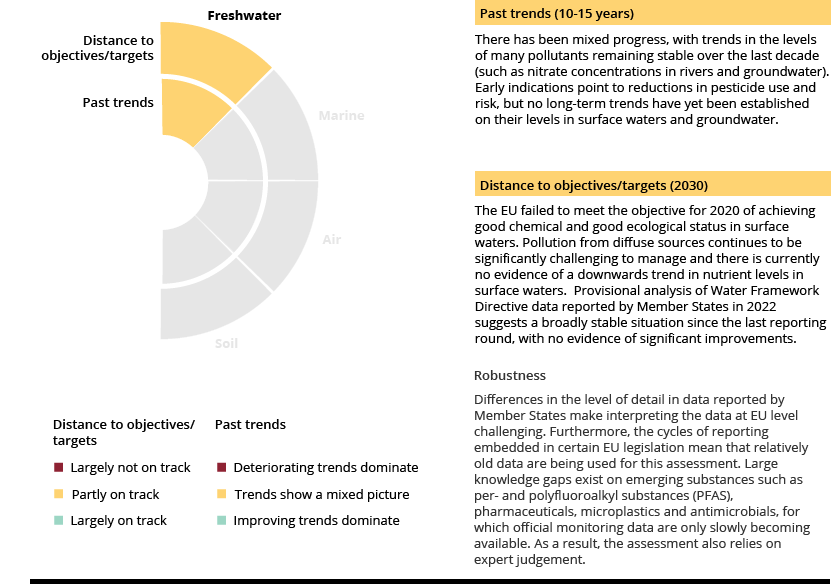
The infographic above summarises the overall findings on freshwater pollution. Two distinct elements are considered:
- whether the past trend in pollution is positive, negative or uncertain
- the current 'distance to target', based on an assessment of the current trends or status and whether or not the EU is on track to achieve the defined zero pollution targets for 2030 and/or other relevant policy targets.
The assessment is based on a combination of (1) available indicators and data, as presented below, and (2) expert judgement.
Introduction
Unpolluted water is essential for healthy ecosystems, as well as for drinking, sanitation, agriculture, industry, energy production and recreation. The EU Water Framework Directive (WFD) requires that European waters achieve good ecological and good chemical status. It relies on the effective and integrated implementation of a broad range of supporting legislation to achieve these objectives in areas including industrial pollution, chemicals, agriculture, urban wastewater treatment, drinking water, nutrient management and marine environmental protection.
Key sources of freshwater pollution include agriculture, mining activities, industrial emissions, urban wastewater discharges and waste management facilities (e.g. landfill sites). Pollution from agriculture remains the most difficult to address because of its diffuse nature (e.g. compared with a sewer pipe discharging into a river at a fixed location). The European Commission has recently proposed a zero pollution package that addresses water pollution. The package includes a revised list of surface water and groundwater pollutants which are required to be more tightly controlled. It also includes a revision of the Urban Wastewater Treatment Directive with new elements, such as requirements to monitor microplastics and new standards for micropollutants.
Nutrients in water bodies
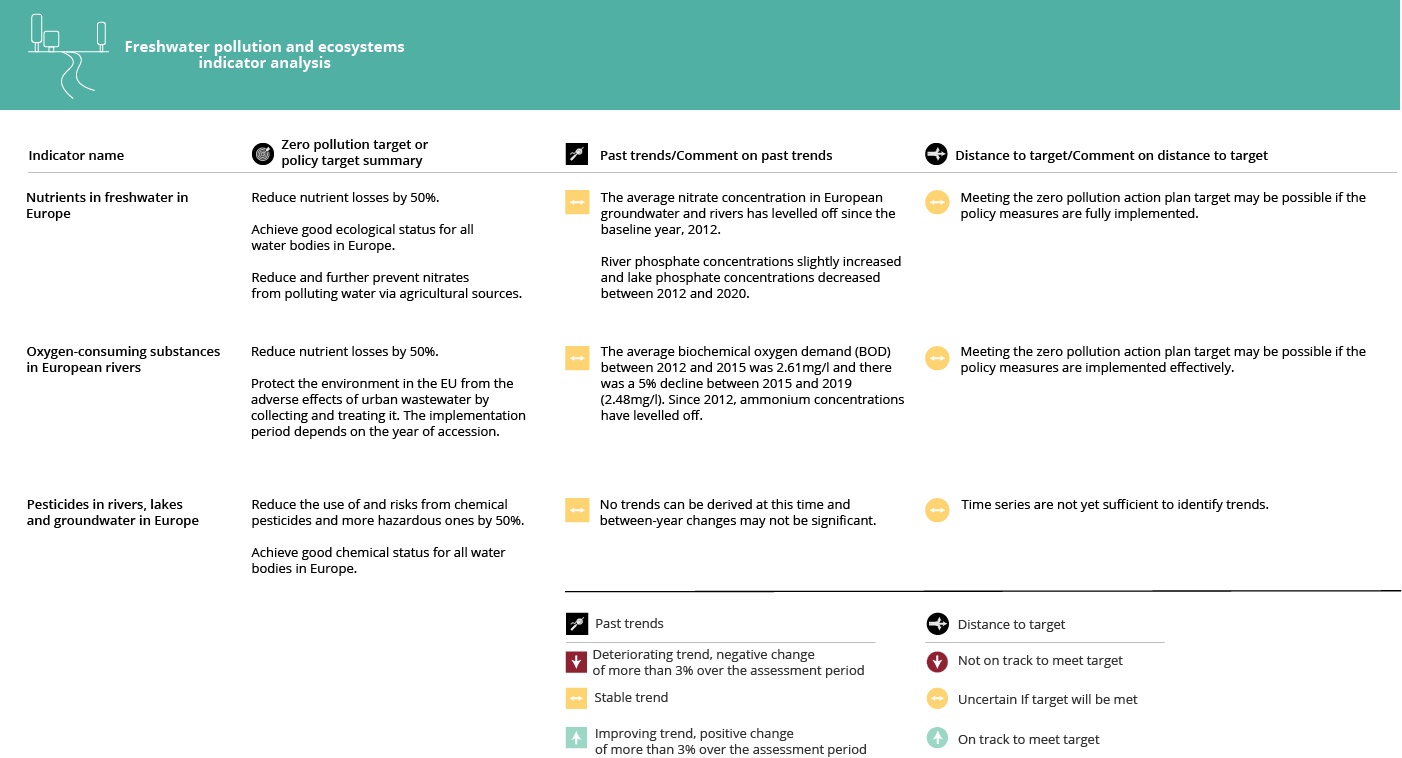
Excessive nutrients in water bodies lead to algae growth — affecting water quality, oxygen levels and biodiversity, and resulting in species loss and potentially long-term damage to these sensitive ecosystems. Figure 4 illustrates that nutrient concentrations in European rivers generally declined between 1990 and 2010. However, over the last decade, nutrient concentrations have levelled off or even shown signs of increasing (e.g. phosphates in rivers are on the rise). This decrease in nutrient concentrations resulted from improvements in wastewater treatment, a reduction in phosphorus in detergents and measures to reduce nutrient pollution from agriculture. However, since 2010, nutrient concentrations have generally levelled off; therefore, further measures may be needed to meet the nutrient reduction targets outlined in the zero pollution action plan. Agriculture remains a significant source of pollution: rivers that drain land used for intensive agriculture activities tend to have high nitrate concentrations. Densely populated areas can also contribute significantly to nitrates in rivers as a result of effluent discharges.
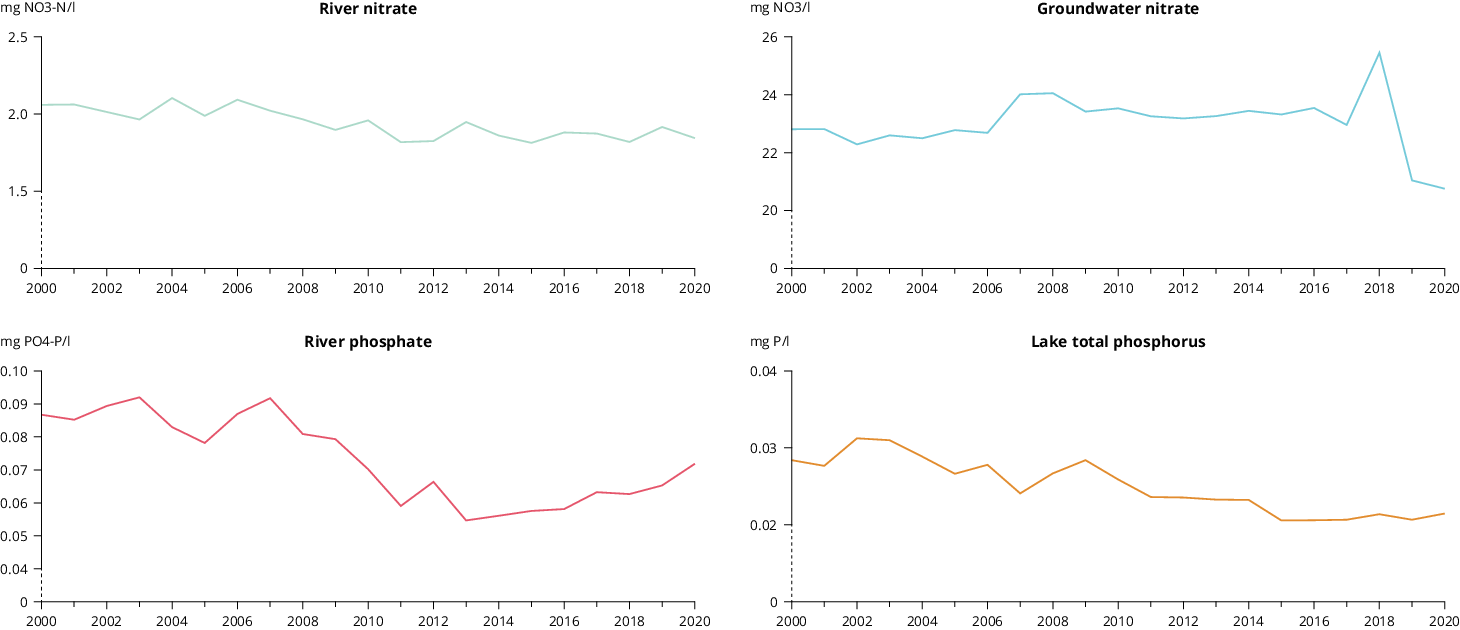
Note: The top charts show trends in nitrate (NO3) levels and the bottom charts show trends in phosphorus (P) and phosphate (PO4) levels.
Source: EEA (2022a).
Click here to view the figure enlarged
Click here for different chart formats and data
The data presented in Figure 4 do, however, mask improvements at the national level in several countries, such as in Denmark, Germany and Slovakia. With that said, other countries and individual monitoring sites show increasing trends over the same period.
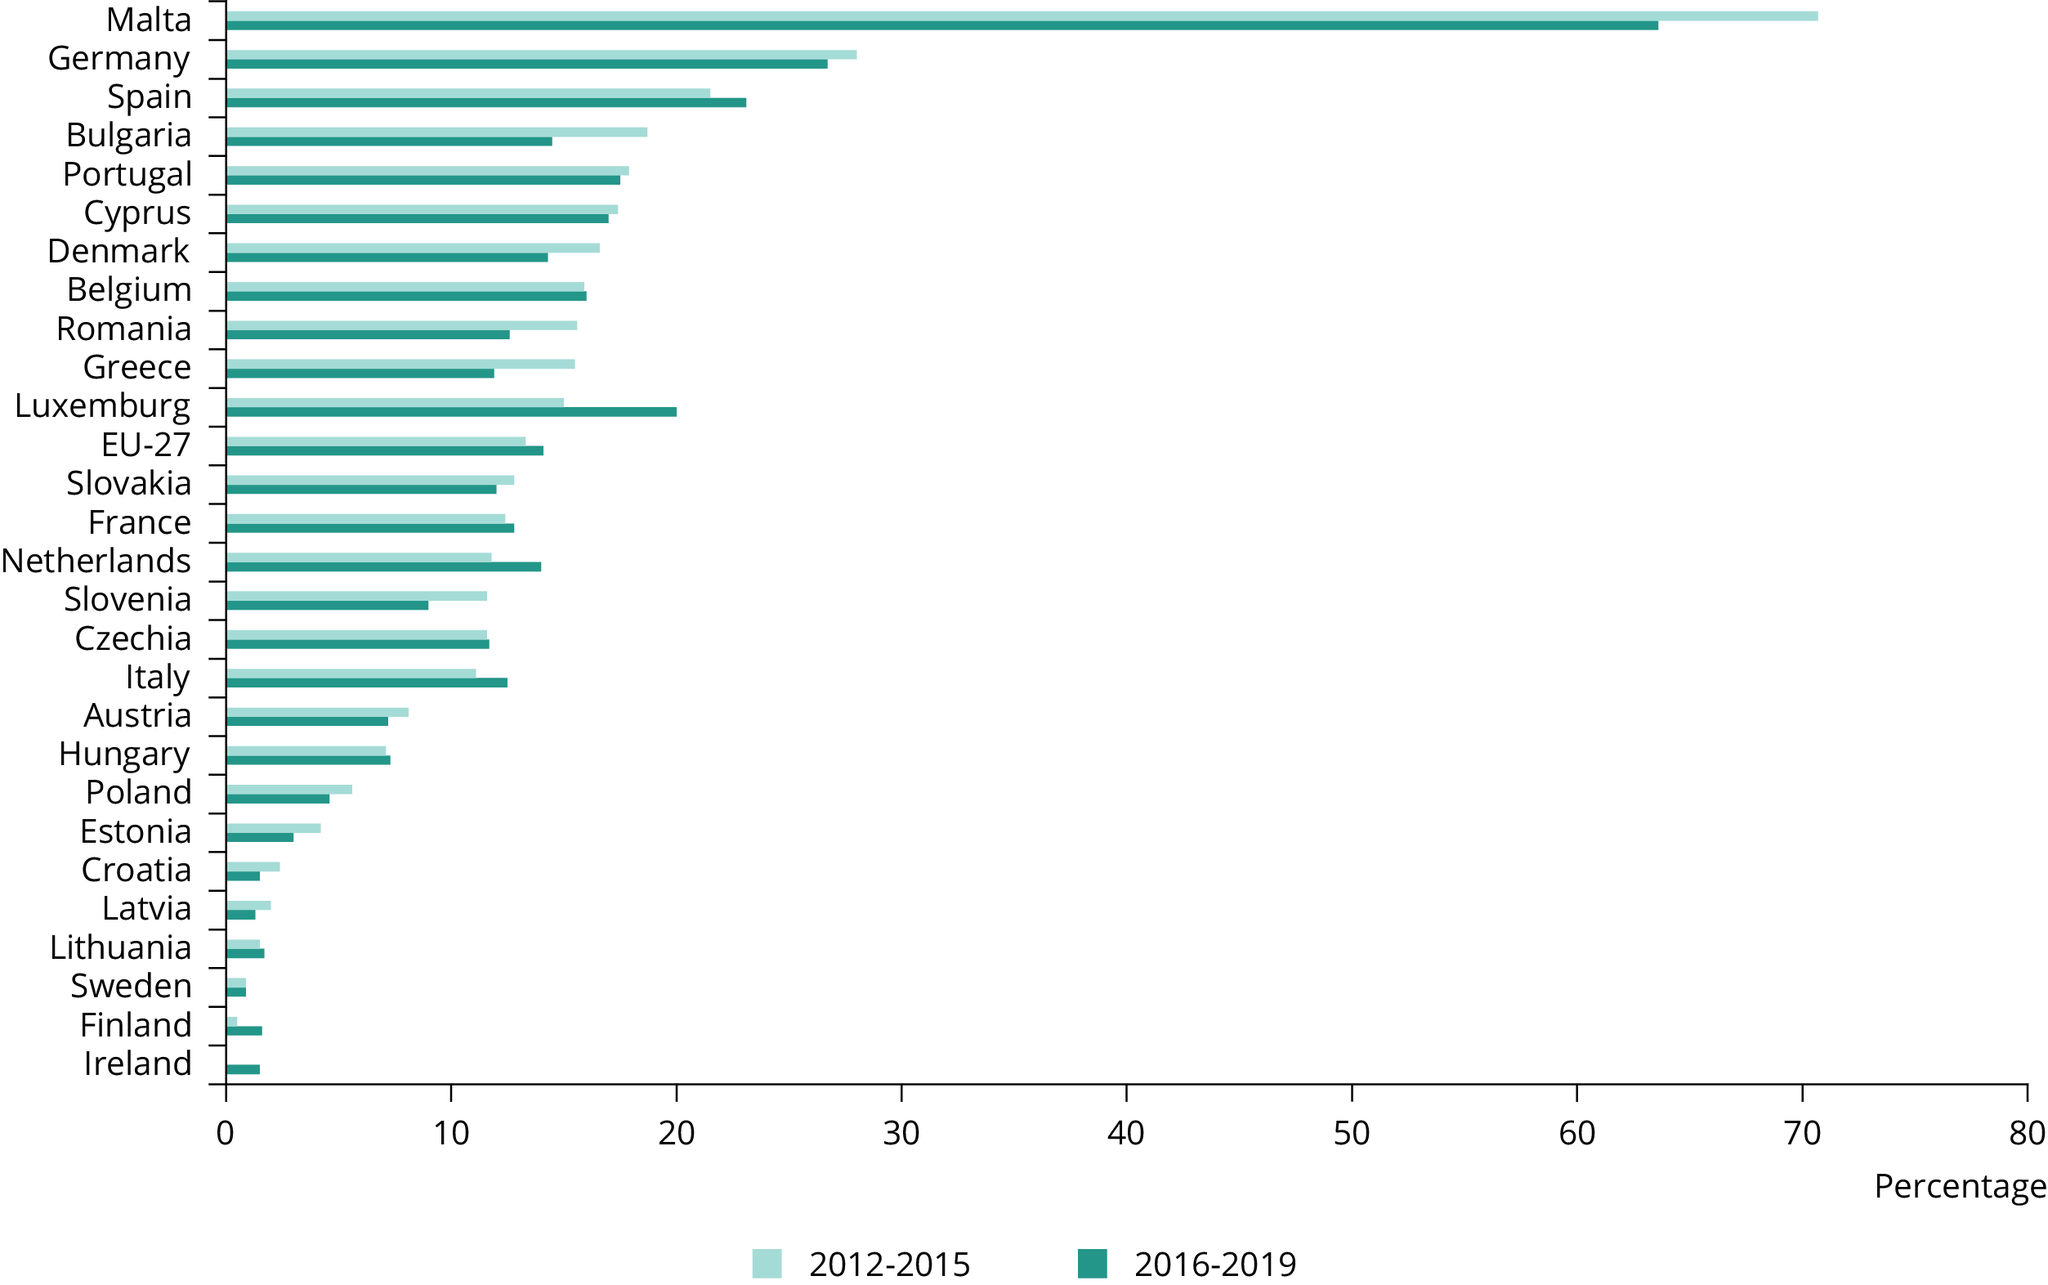
Nitrate levels in groundwater (Figure 5), which pose a pollution risk to drinking water sources, have been relatively stable overall since the early 1990s, although there have been improvements in some countries and deteriorations in others. Data reported by countries indicate that, for the period 2016-2019, 14.1% of groundwater stations exceeded the drinking water standard (EC, 2021). In the previous reporting period, 2012-2015, 13.2% of stations exceeded this standard — pointing to a lack of progress in the most heavily polluted locations.
Source: Reproduced with permission from EC (2021).
Click here for different chart formats and data
Ecological and chemical status of water bodies
The WFD requires that at least a ‘good’ chemical and a ‘good’ ecological status are achieved for European surface waters and a ‘good’ chemical status is achieved for groundwater. The analysis below is based on data reported under the first and second river basin management plan, reported in 2010 and 2016, respectively. Also presented below is a preliminary analysis of data received from the most recent round of reporting in 2022.
Ecological status — surface waters
Around 58% of surface waters reported on in Europe have not achieved good ecological status, mostly because of pollution (EEA, 2021a). Although environmental policies have improved water quality, point or diffuse sources of pollution continue to put significant pressure on surface waters. The percentage of water bodies with less than good (i.e. moderate, poor or bad) ecological status varies significantly between river basin districts across Europe, as shown in Map 1. Surface waters in north-western Europe have the lowest status: in Belgium (Flanders), northern Germany and the Netherlands, the ecological status of more than 90% of surface waters is less than good.
Chemical status — surface waters
A good chemical status is defined as achieving all the quality standards established for chemical substances at the EU level. Data reported by EU Member States under their second river basin management plans show that only 41.5% of water bodies have achieved good chemical status (Map 1). Barriers to achieving good chemical status include a small number of ubiquitous, persistent, bioaccumulative and toxic substances, such as mercury and polycyclic aromatic hydrocarbons (PAHs). These pollutants can enter water bodies directly through effluent discharges or indirectly when deposited from the atmosphere. It should also be noted that variations among countries in interpreting the WFD requirements result in some uncertainty in interpreting the data. Excluding these specific pollutants from the assessment would mean that only 3% of sites would be considered non-compliant. However, the persistent nature of these substances means that they will remain in the environment for a long time, even after they stop being released.
Source: EEA
Chemical status — groundwater
As well as harming surface water quality, chemicals can also affect the chemical status of groundwater. Around 23% by area and 14.5% by number of groundwater bodies in the 27 EU Member States (EU-27) have ‘poor’ chemical status. Diffuse pollution from agriculture is, again, the most common source of pressure — affecting 19% of the total groundwater area of the EU-27 (EEA, 2022b).
Preliminary analysis of 3rd RBMP data received in 2022
In order to provide a more up to date assessment of progress in achieving the objectives of the Water Framework Directive, a preliminary analysis was completed on data received by mid-September 2022 from 11 Member States. This analysis attempts to identify any significant changes in status between the second and third River Basin Management Plans (RBMPs). A more detailed and structured analysis will be completed by 2024, feeding into the 2nd edition of the zero pollution monitoring assessment. This analysis gives an initial sense of progress and provides the following high-level findings:
Surface water ecological status: The data show a mixed but slightly improving trend in ecological status. Ecological status improved for three countries (Germany, Hungary and Latvia), was stable for two countries (Austria and Italy) and deteriorated for two countries (Czechia and Slovakia). A comparison was not possible at this stage for four Member States (Belgium, Finland, Luxembourg and the Netherlands) due to the absence of consolidated information at a national level.
Surface water chemical status: The data show a mixed trend. Chemical status improved for one country (Italy), was stable for two countries (Austria and Germany). A comparison was not possible at this stage for the eight other Member States (Belgium, Czechia, Finland, Hungary, Latvia, Luxembourg, the Netherlands and Slovakia) due to changes in the number of water bodies, an increase in the number of monitored chemical substances, or the absence of consolidated information at a national level.
Groundwater chemical status: Groundwater chemical status remained mostly stable. Although a few countries showed improvement (Germany and Italy) or deterioration (Latvia), the chemical status of groundwaters did not change significantly in the remaining countries (Austria, Czechia, Hungary and Slovakia). A comparison was not possible at this stage for four Member States (Belgium, Finland, Luxembourg and the Netherlands) due to the adapted methodology, the increase in the number of monitored priority substances, or the absence of consolidated information at a national level.
Note: The EEA has based its initial analysis on data extracted from the 3rd River Basin Management Plan submissions received, by 16 September 2022, from 11 Member States (legal deadline for submission under the Water Framework Directive was 22nd March 2022). Other countries have subsequently submitted data, however these could not be retrospectively included in the assessment. Relevant Member States were consulted as part of the preparation of this assessment, which has to be considered as merely preliminary.
Pesticides
Pesticides affect organisms such as plants, insects and fungi. Pesticides applied to land can also leach into and pollute groundwater and drinking waters, and can contaminate surface waters. The zero pollution target for pesticides is to reduce both the use of and risks from chemical pesticides, and in particular the use of more hazardous pesticides by 50% (compared with the 2015-2017 baseline period). More hazardous pesticides are defined as substances that are candidates for substitution under the Plant Protection Products Regulation due to their particularly hazardous properties; hence, it is important to focus on reducing the use of these pesticides. According to the European Commission, there was a 14% reduction in the use of and risks from chemical pesticides in 2020, while the use of more hazardous pesticides decreased by 26% (EC, 2022a). This steady and continuous initial downwards trend is a positive sign; it suggests that the targets could be met if countries sustain and increase their efforts to reduce the use of and risks from pesticides. Nevertheless, the increasing number of emergency authorisations granted by Member States for pesticide uses that are restricted is a concern, with a 38% increase seen over the period from 2011 to 2020 (EC, 2022b).
However, the EEA indicator on pesticides in rivers, lakes and groundwater in Europe finds that pesticide levels exceeded safe ‘effect’ thresholds in 22% of all reported monitoring sites in European surface waters in 2020. Threshold exceedances of more than 30% were reported in 18 out of 29 countries for surface waters, and in 1 out of 22 countries for groundwater. High exceedance rates were reported at monitoring sites mainly in large and medium-sized rivers (EEA, 2022c).
No clear trend is currently apparent for pesticides in freshwater bodies. A trend may become apparent in the next few years as more data become available.
Emerging substances
Certain ‘emerging substances’ are a severe pollution concern in European waters, as explained in the accompanying freshwater ‘Signal’ on emerging substances. The range of chemicals regularly monitored in freshwater is limited. To properly assess the abundance and impacts of emerging substances, more information should be gathered on certain chemicals such as per- and polyfluoroalkyl substances (PFAS), pharmaceuticals, microplastics and antimicrobials.
PFAS are of particular concern. Today, more than 9,200 PFAS are in commercial use across more than 200 use categories — from industry to consumer products and medical and food products. Further details are available in the zero pollution cross-cutting story on PFAS.
While urban wastewater treatment plants often reduce the concentrations of many chemicals, they are principally designed to remove solids, organic material, microbes and nutrients. Therefore, some contaminants pass through the treatment process and are released into receiving waters (or retained in sludge).
The zero pollution legislative package, published in October 2022, will help increase knowledge about and control of emerging substances. The package includes a revised list of surface water and groundwater pollutants which must be more tightly controlled, and a proposed revision of the Urban Wastewater Treatment Directive.
Note: Link to indicators:- Nutrients in freshwater in Europe, Oxygen consuming substances in European rivers, Pesticides in rivers, lakes and groundwater in Europe.
Overview of indicator analysis methodology
This indicator analysis is in line with the approach taken by the EEA for its seventh environment action programme monitoring.
Past trends are based on assessment of the trend over the last 10 years (or since the relevant zero pollution baseline year where appropriate) with green, yellow or red being applied based on the criteria as outlined in the figure legend. Expert judgement is also applied, for example in cases where indicators are more qualitative and/or uncertain.
The distance to target is based on an assessment of the recent trend, current status and expert judgement.
Further detailed analysis of the future outlook for meeting certain zero pollution targets is included in the zero pollution outlook 2022, completed by the European Commission Joint Research Centre (JRC, 2022).
References
EC, 2021, Report from the Commission to the Council and European Parliament on the implementation of Council Directive 91/676/EEC concerning the protection of waters against pollution caused by nitrates from agricultural sources based on Member State reports for the period 2016-2019 (COM(2021) 1000 final of 11 October 2021) (https://eur-lex.europa.eu/legal-content/EN/TXT/?uri=COM%3A2021%3A1000%3AFIN&qid=1633953687154) accessed 13 October 2022.
EC, 2022a, ‘Trends in the use and risk of chemical pesticides and the use of more hazardous pesticides’, EU: Trends, European Commission (https://food.ec.europa.eu/plants/pesticides/sustainable-use-pesticides/farm-fork-targets-progress/eu-trends_en) accessed 10 October 2022.
EC, 2022b, ‘Trends in harmonised risk indicators for the European Union’, European Commission (https://food.ec.europa.eu/plants/pesticides/sustainable-use-pesticides/harmonised-risk-indicators/trends-eu_en#fig2) accessed 4 November 2022.
EEA, 2021a, ‘Ecological status of surface waters in Europe’, (https://www.eea.europa.eu/ims/ecological-status-of-surface-waters) accessed 13 October 2022.
EEA, 2022a, ‘Nutrients in freshwater in Europe’, European Environment Agency (https://www.eea.europa.eu/ims/nutrients-in-freshwater-in-europe) accessed 13 October 2022.
EEA, 2022b, ‘Europe’s groundwater — a key resource under pressure’, European Environment Agency (https://www.eea.europa.eu/publications/europes-groundwater) accessed 14 October 2022.
EEA, 2022c, ‘Pesticides in rivers, lakes and groundwater in Europe’, European Environment Agency (https://www.eea.europa.eu/ims/pesticides-in-rivers-lakes-and) accessed 13 October 2022.
JRC, 2022, Zero pollution outlook 2022, JRC129655, Publications Office of the European Union, Luxembourg, Joint Research Centre (https://joint-research-centre.ec.europa.eu/zero-pollution-outlook-2022_en) accessed 1 December 2022.
Teunen, L., et al., 2021, ‘PFAS accumulation in indigenous and translocated aquatic organisms from Belgium, with translation to human and ecological health risk’, Environmental Sciences Europe 33, 39 (https://doi.org/10.1186/s12302-021-00477-z).
Cover image source: © Panagiotis Dalagiorgos, Well with Nature /EEA

Document Actions
Share with others