next
previous
items

Air Pollution and health

Page Last modified 08 Dec 2022
12 min read
This section of the zero pollution monitoring assessment presents available knowledge and trends on air pollution and associated impacts on health, and assesses progress towards achieving relevant zero pollution targets and policy objectives.

Key messages

  • Air pollution is the greatest single environmental health risk in the EU. In 2020, exposure to concentrations of fine particulate matter above the 2021 World Health Organization guideline level resulted in 238,000 premature deaths in the EU-27.
  • Premature deaths attributed to exposure to fine particulate matter in the EU-27 have fallen by 45% since 2005 as a result of better air quality. Based on past progress, the EU is on track to reach the zero pollution target of reducing premature deaths linked to air pollution by 55% in 2030.
  • Air pollution also causes morbidity, whereby people live with disease — entailing both personal suffering and significant health care costs.
  • Around 96% of the EU’s urban population remains exposed to levels of fine particulate matter that damage health.
  • Pollution levels (and their associated health impacts) are consistently higher in the more disadvantaged regions of Europe than in the less disadvantaged regions.
  • Further efforts will be needed to meet the zero pollution vision for 2050 of reducing air pollution to levels no longer considered harmful to health.


Figure 3. Summary analysis: air pollution and health 


Guidance for interpreting the summary

The infographic above summarises the overall findings on air pollution. Two dimensions are considered:

  1. whether the past trend in pollution is positive, negative or uncertain
  2. the current 'distance to target', based on an assessment of the current trends or status and whether or not the EU is on track to achieve the defined zero pollution targets for 2030 and/or other relevant policy targets.

The assessment is based on a combination of (1) available indicators and data, and (2) expert judgement.


Introduction

Air pollution is the greatest environmental health risk in the EU. As a result, the EU has implemented a clean air policy and set standards for key air pollutants in the ambient air quality directives. Most of the air quality plans implemented by Member States in response to exceedances of the standards explicitly aim to protect health; the majority focus on reducing levels of nitrogen dioxide (NO2) and coarse particulate matter (PM10) (EEA, 2022a).

The EU’s air quality standards, established in the 2000s, are less strict than the recently updated World Health Organization (WHO) air quality guidelines. In October 2022, the European Commission published a proposed zero pollution legislative package, including a proposed revision of the ambient air quality directives, building on its zero pollution commitment to align air quality standards more closely with WHO’s recommendations. In parallel, stricter requirements are also foreseen to tackle air pollution at its source, such as from agriculture, industry, transport, buildings and energy.

Air pollutant emissions are regulated under the National Emission Reduction Commitments Directive (the NEC Directive). Progress towards realising the directive’s commitments is outlined in the cross-cutting story on the NEC Directive.


How air pollution impacts health

In 2020, air pollution led to a significant number of premature deaths in the EU-27. 

  • Exposure to concentrations of fine particulate matter above the 2021 World Health Organization guideline level resulted in 238,000 premature deaths.
  • Exposure to nitrogen dioxide above the respective guideline level led to 49,000 premature deaths.
  • Acute exposure to ozone caused 24,000 premature deaths (EEA, 2022b).

Exposure to air pollution is a leading cause of chronic disease, including stroke, cancer and diabetes (see Figure 4). In addition, some individuals are more sensitive to the health impacts of air pollution than others because of their age, pre-existing health conditions and particular behaviours (EEA, 2020). For children, air pollution has a negative effect on neural development and cognitive capacities. This can affect performance at school and later in life, leading to lower productivity and quality of life (Unicef, 2017).

More generally, ill health from air pollution leads to a loss of productivity, absenteeism, increased hospitalisations, loss of healthy years of life and, in the most serious cases, premature death.

Figure 4. Impacts of air pollution on health

Figure 4. Impacts of air pollution on health


Note: BaP, benzo[α]pyrene; PM, particulate matter; O3, ozone; NO2, nitrogen dioxide; SO2, sulphur dioxide.

SourceEEA (2022c).

Click here to view the figure enlarged


Air pollution also causes morbidity, whereby people live with disease, resulting in personal suffering as well as significant costs on the health care sector. In 2019, exposure to PM2.5 led to 175,702 years lived with disability (YLDs) due to chronic obstructive pulmonary disease in 30 European countries. At the same time, exposure to NO2 led to 175,070 YLDs due to diabetes mellitus (also known as Type 2 diabetes) in 31 European countries. That same year, 12,253 people across 23 European countries were admitted to the hospital with lower respiratory infections resulting from acute exposure to ozone (EEA, 2022b).

Air pollution is not just detrimental to health: it also leads to significant economic costs. A 2020 study estimated the health-related social costs of air pollution in cities of 30 European countries (the EU-27 plus Norway, Switzerland and the United Kingdom) to be over EUR166 billion in a single year, 2018. It was estimated that European city dwellers suffered an average welfare loss of over EUR1,250 a year, equivalent to 3.9% of income. There were significant differences across Europe, with costs amounting to between 8% and 10% of income earned in cities in Bulgaria, Poland and Romania. Most of these costs relate to premature mortality (76%), with a smaller proportion (24%) related to morbidity (illness) (CE Delft, 2020).

A number of additional pollutants, such as black carbon, are not covered by current EU air policies and monitoring frameworks but may pose a threat to health, as explained in the zero pollution ‘Signal’ on emerging pollutants. For example, in its 2021 air quality guidelines, WHO identifies evidence of health impacts from exposure to black carbon, ultrafine particles and sand dust storms (WHO, 2021).

People’s health may also be affected by indoor air pollution (see zero pollution ‘Signal’ on indoor air quality), particularly given that people spend up to 90% of their time indoors (Vardoulakis et al., 2020). Workplaces can also be a significant source of exposure to pollutants, as explored further in the health and chemicals section.


Progress towards zero pollution — fine particulate matter

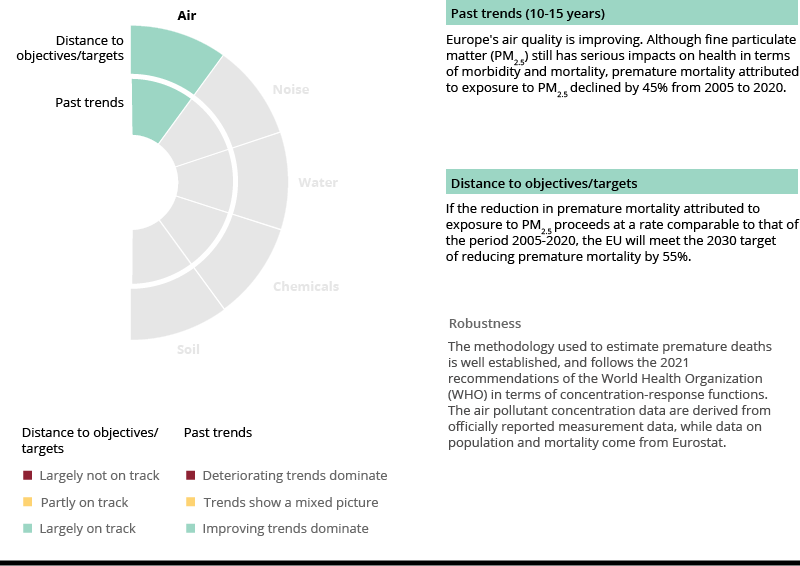
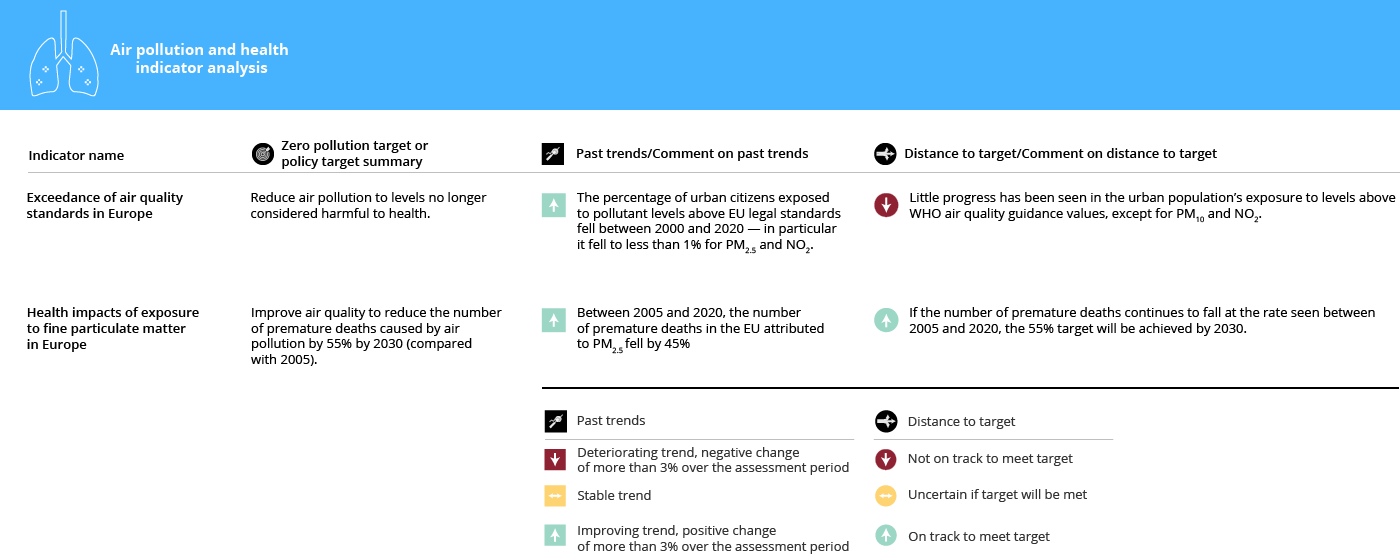
The zero pollution action plan sets the target of improving air quality, with a focus on fine particulate matter (PM2.5), as this pollutant is responsible for the majority of premature deaths caused by air pollution in the EU. Meeting the target requires a minimum 55% reduction in premature deaths by 2030, relative to 2005 levels (EC, 2022a). The EEA estimates that 431,000 premature deaths were attributable to exposure to PM2.5 in 2005 in the EU-27 (EEA, 2022d). Achieving a 55% reduction would require that premature deaths fall to 194,000 per year.

From 2005 to 2020, premature deaths attributed to PM2.5 fell by 45% (see Figure 5) in the EU-27. This is primarily because less emissions came from burning fossil fuels and pollution abatement equipment was introduced across the industry and road transport sectors (for example). Should air quality continue to improve, and the number of premature deaths per year continue to fall at a comparable rate, then the target will be achieved before 2030.

To meet the target, Member States will need to fully implement their national air pollution control programmes, as well as measures needed to reach the 2030 climate and energy targets (EC, 2022b). However, the upwards trends in ageing and urbanisation in Europe counteract some of the health gains associated with reducing ambient air pollutant concentrations. Specifically, older populations are more sensitive to air pollution (see zero pollution ‘Signal’ on vulnerable groups) and a higher rate of urbanisation typically means that more people are exposed to high PM2.5 concentrations.
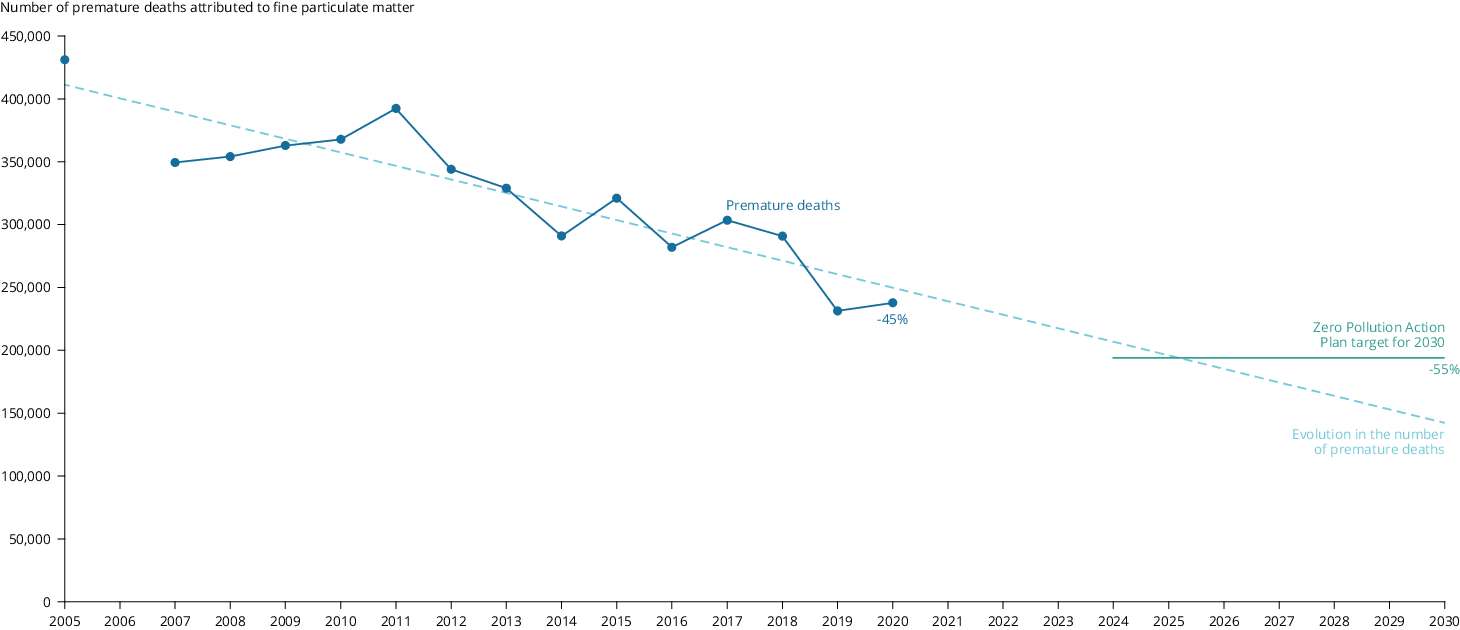
Figure 5. Premature deaths in the EU-27 due to PM₂.₅ levels above the 2021 WHO guidelines and distance to the zero pollution target, 2005-2020


Source: EEA, 2022d.

Click here to view the figure enlarged

Click here for different chart formats and data


Urban exposure to air pollution

In 2020, the vast majority of the EU’s urban population was exposed to levels of key air pollutants that are damaging to health. In particular, 96% of the urban population was exposed to concentrations of PM2.5 above the WHO guideline value of 5µg/m3.

Figure 6 shows the percentage of the urban population exposed to air pollutant levels higher than those outlined in both the EU standards and the WHO guidelines. It also highlights the difference between these values, that is, how much less stringent the EU standards are than the latest guideline values set by WHO to protect health. Bringing the EU’s PM2.5 limit closer to the WHO guidelines would deliver significant health benefits. Overall, closely aligning EU air quality standards with the WHO recommendations would represent an important step towards cleaner air in Europe in line with the long-term zero pollution ambition.

Figure 6. Share of the EU urban population exposed to air pollutant concentrations above EU standard and WHO guideline values in the EU-27, 2020


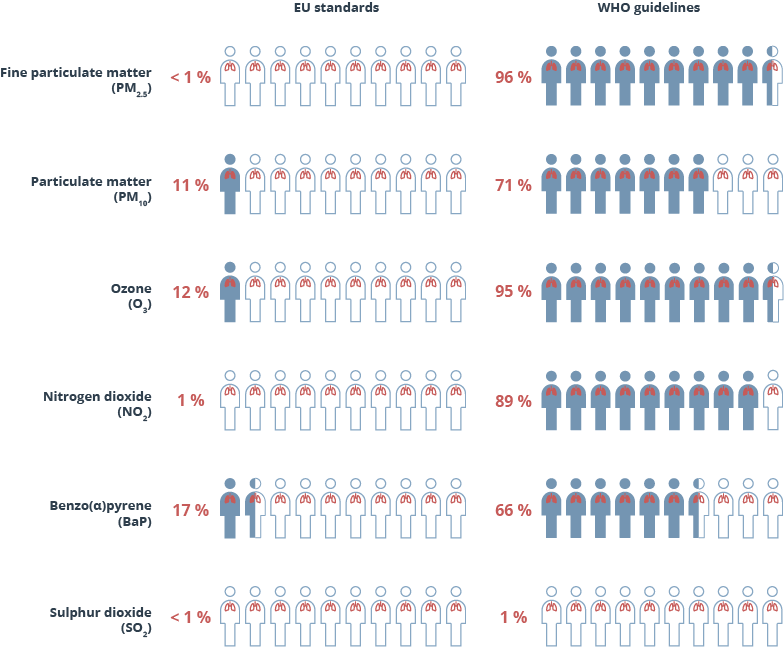
Source: EEA (2022e).


Inequity in exposure to air pollution

The impacts of air pollution are not evenly distributed across society. Clear evidence links lower socio-economic status to higher exposure to air pollution (EEA, 2018). In large parts of Europe, poorer people are more likely to live next to busy roads or industrial areas and face higher levels of exposure to pollution. In addition, the most deprived people in society often have poorer health and less access to high-quality medical care, increasing their vulnerability.

Figure 7 presents trends in concentrations of PM2.5, weighted by population, of the most disadvantaged regions and the least disadvantaged regions in terms of gross domestic product (GDP) per capita. While air quality has improved in both the wealthiest regions and the poorest regions, a gap remains between the two. Air pollutant concentrations fell by 36% in the wealthier regions from 2009 to 2019 — faster than in the poorer regions, where the decrease was only 25%.

Figure 7. Trends in population-weighted average annual concentrations of PM2.5 in the most disadvantaged and least disadvantaged quintiles of EU-27 NUTS 3 regions, 2007-2019


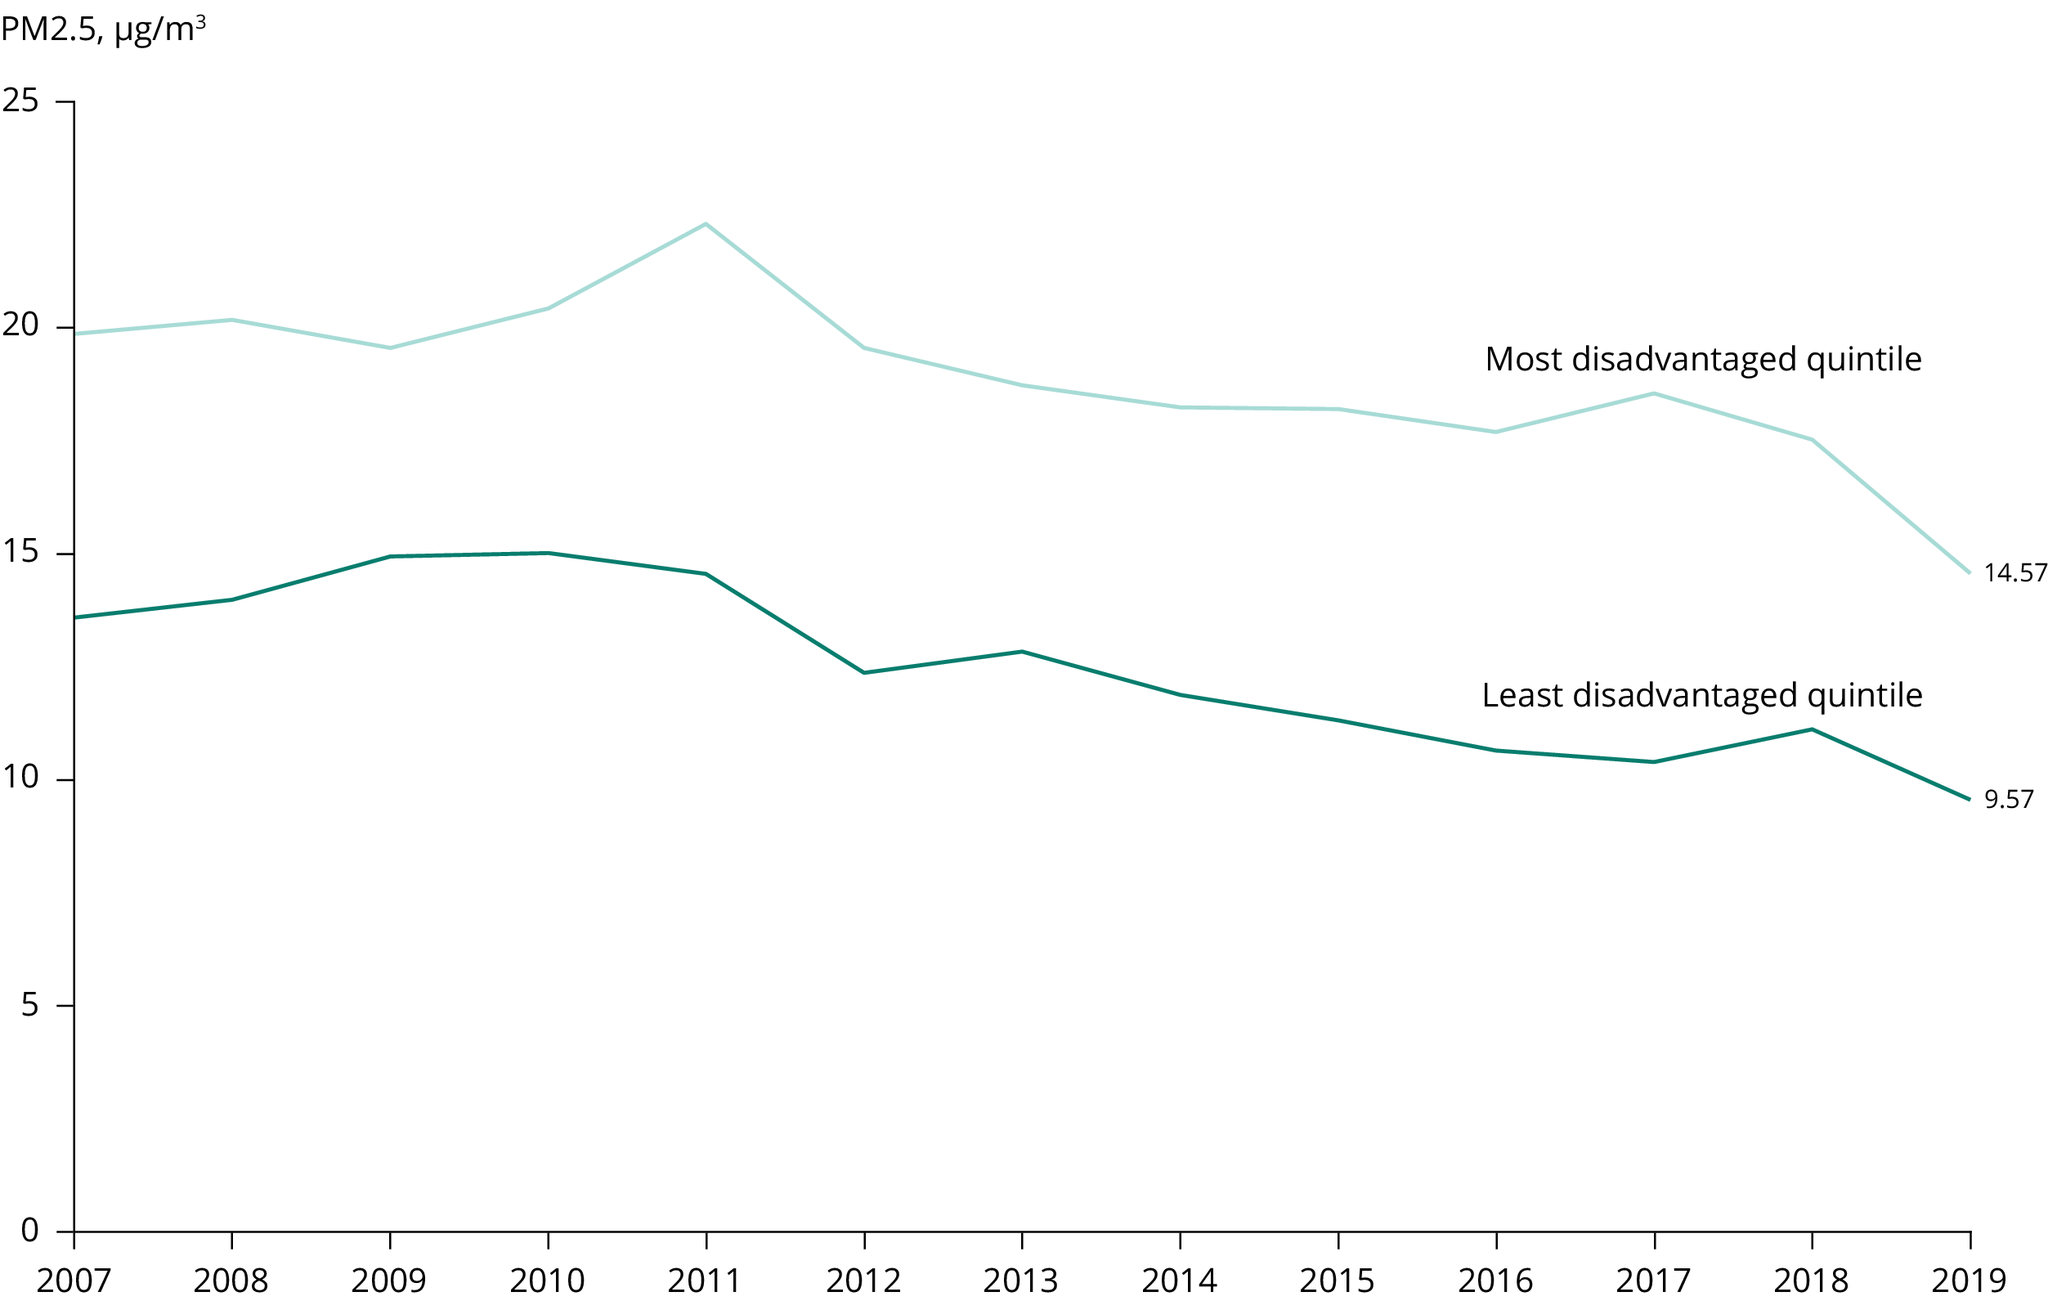
Note: Most disadvantaged and least disadvantaged quintiles are based on Eurostat data on GDP per capita. Nomenclature of Territorial Units for Statistics (NUTS) 3 regions are from Eurostat’s Geostat 2011 population grid data set. Population-weighted concentrations are based on an EEA analysis of interpolated annual statistics of reported monitoring data from 2018.

Sources: EEA (2022f) for air quality data and Eurostat (2022) for GDP data.

Click here for different chart formats and data


Other air pollutant concentrations in outdoor air

While the EEA Air Quality Report (2022f) reveals that air quality has improved significantly since 2005, exceedance of EU standards is a continuing trend across Europe. Concentrations of most pollutants are also well above WHO guidelines in almost all Member States (EEA, 2022b). For PM10, PM2.5, NO2 and benzo[α]pyrene (BaP), the percentage of EU monitoring stations reporting exceedances is declining. On the other hand, SO2 concentrations are marginally increasing. Concentrations of O3 are strongly influenced by temperature; as a result, there is significant interannual variation in exceedances.

To assess air quality, monitoring is normally undertaken at fixed stations and complemented by modelling — with data reported to the EEA and made publicly available. Recently, using simple, low-cost devices to measure local air pollution levels through citizen science initiatives has become popular, as explained in the zero pollution ‘Signal’ on new approaches to assessing air quality. In the near future, citizen science initiatives coupled with new data digitalisation approaches may lead to a paradigm shift in the way that air quality is assessed. Rather than relying on a single monitoring station to measure impacts for a large number of people, combining these two unique approaches would enable a more accurate assessment of air quality.

Figure 8. Indicator analysis — air pollution and health


Note: Links to indicators: Exceedance of air quality standards in Europe, Health impacts of exposure to fine particulate matter in Europe.


Overview of indicator analysis methodology

This indicator analysis is in line with the approach taken by the EEA for its seventh environment action programme monitoring.

Past trends are based on assessment of the trend over the last 10 years (or since the relevant zero pollution baseline year where appropriate) with green, yellow or red being applied based on the criteria as outlined in the figure legend. Expert judgement is also applied, for example in cases where indicators are more qualitative and/or uncertain.

The distance to target is based on an assessment of the recent trend, current status and expert judgement. 

Further detailed analysis of the future outlook for meeting certain zero pollution targets is included in the zero pollution outlook 2022, completed by the European Commission Joint Research Centre (JRC, 2022).

References

CE Delft, 2020, Health costs of air pollution in European cities and the linkage with transport, Publication Code 20.190272.134, CE Delft, Delft (https://cedelft.eu/publications/health-costs-of-air-pollution-in-european-cities-and-the-linkage-with-transport/) accessed 6 October 2022.

EC, 2022a, ‘Zero pollution action plan: towards zero pollution for air, water and soil’, European Commission (https://environment.ec.europa.eu/strategy/zero-pollution-action-plan_en) accessed 5 October 2022.

EC, 2022b, Report from the Commission to the European Parliament, the Council, the European Economic and Social Committee and the Committee of the Regions ‘The Third Clean Air Outlook’ (COM (2022) 673) (https://environment.ec.europa.eu/topics/air/clean-air-outlook_en) accessed 1 December 2022.

EEA, 2018, Unequal exposure and unequal impacts: social vulnerability to air pollution, noise and extreme temperatures in Europe, EEA Report No 22/2018, European Environment Agency (https://www.eea.europa.eu/publications/unequal-exposure-and-unequal-impacts/) accessed 6 October 2022.

EEA, 2020, Healthy environment, healthy lives: how the environment influences health and well-being in Europe, EEA Report No 21/2019, EEA (https://www.eea.europa.eu/publications/healthy-environment-healthy-lives) accessed 6 October 2022.

EEA, 2022a, ‘Managing air quality in Europe’, European Environment Agency (https://www.eea.europa.eu/publications/managing-air-quality-in-europe) accessed 26 October 2022.

EEA, 2022b, ‘Europe’s air quality status 2022’, European Environment Agency (https://www.eea.europa.eu/publications/status-of-air-quality-in-Europe-2022/europes-air-quality-status-2022) accessed 7 October 2022.

EEA, 2022c, ‘Air pollution: how it affects our health’, European Environment Agency (https://www.eea.europa.eu/themes/air/health-impacts-of-air-pollution), accessed October 25 2022.

EEA, 2022d, ‘Health impacts of exposure to fine particulate matter in Europe’, European Environment Agency (https://www.eea.europa.eu/ims/health-impacts-of-exposure-to), accessed 15 November 2022.

EEA, 2022e, ‘Exceedance of air quality standards in Europe’, European Environment Agency (https://www.eea.europa.eu/ims/exceedance-of-air-quality-standards) accessed 6 October 2022.

EEA, 2022f, ‘Air quality health risk assessments(NUTS3)’, European Environment Agency (https://www.eea.europa.eu/data-and-maps/data/air-quality-health-risk-assessments), accessed 25 October 2022.

Eurostat, 2022, ‘Gross domestic product (GDP) at current market prices by NUTS 3 regions [nama_10r_3gdp]’, Eurostat Data Explorer (https://appsso.eurostat.ec.europa.eu/nui/show.do?dataset=nama_10r_3gdp&lang=en) accessed 7 October 2022.

JRC, 2022, Zero pollution outlook 2022, JRC129655, Publications Office of the European Union, Luxembourg, Joint Research Centre (https://joint-research-centre.ec.europa.eu/zero-pollution-outlook-2022_en) accessed 1 December 2022.

Unicef, 2017, Danger in the air: how air pollution can affect brain development in young children, United Nations Children’s Fund, New York (https://www.unicef.org/sites/default/files/press-releases/glo-media-Danger_in_the_Air.pdf) accessed 6 October 2022.

Vardoulakis, S., et al., 2020, ‘Indoor exposure to selected air pollutants in the home environment: a systematic review’, International Journal of Environmental Research and Public Health17(23), 8972 (https://doi.org/10.3390/ijerph17238972).

WHO, 2021, WHO global air quality guidelines: particulate matter (PM2.5 and PM10), ozone, nitrogen dioxide, sulfur dioxide and carbon monoxide, World Health Organization (https://apps.who.int/iris/bitstream/handle/10665/345329/9789240034228-eng.pdf?sequence=1&isAllowed=y) accessed 7 October 2022.

Cover image source: © Evangelija Ivanoska, Well with Nature /EEA

Permalinks

Geographic coverage

Topics

Tags

Filed under:
Filed under: zero pollution
Document Actions