This briefing assesses levels of air pollutants in ambient air across Europe and compares them against both European Union (EU) standards as set out in the ambient air quality directives and the 2021 World Health Organization (WHO) global air quality guidelines. For the 2020 analysis, these 2021 guidelines have been used as they represent the most up-to-date framework for assessing the impacts of air pollution on human health. The EU air quality standards are less strict for all pollutants than the WHO air quality guidelines.
Under the European Green Deal’s Zero Pollution Action Plan, the European Commission set the 2030 goal of reducing the number of premature deaths caused by fine particulate matter (PM2.5, a key air pollutant), by at least 55% compared with 2005 levels. To this end, the European Commission initiated a revision of the ambient air quality directives, aiming, among other things, to align the air quality standards more closely with WHO recommendations. In parallel, stricter requirements are also foreseen to tackle air pollution at source, such as pollution from agriculture, industry, transport, buildings and energy supply.
In 2020, after the start of the COVID-19 pandemic, most European countries implemented lockdown measures to stop or minimise the spread of the disease. Those measures led to a reduction in activity in the road transport, aviation and international shipping sectors, which in turn led to falls in emissions of air pollutants. While some industrial sectors also reduced activity levels, the level of agricultural production stayed more or less steady. Emissions from domestic heating increased slightly as people stayed at home. The overall effect on concentrations varies by pollutant, with the most significant ones summarised below.
Despite reductions in emissions, in 2020 most of the EU’s urban population was exposed to levels of key air pollutants that are damaging to health (see Figure 1). In particular, 96% of the urban population was exposed to concentrations of fine particulate matter (PM2.5) above the 2021 WHO guideline of 5 µg/m3.

Source: AIR003
PM10 stands for particulate matter with a diameter of 10 µm or less. PM10 are emitted mainly by the combustion of fuels for domestic heating, while industrial activities, agriculture and road transport are also important sources. Some also come from natural sources such as sea salt or Saharan dust and some are formed in the atmosphere from the combination of different gases.
Exceedances of the EU daily limit value for PM10 are seen in Italy and some eastern European countries (Figure 2). In most central and eastern European countries, solid fuels such as coal are widely used for heating households and in some industrial facilities and power plants. The Po Valley, in northern Italy, is a densely populated and industrialised area with specific meteorological and geographical conditions that favour the accumulation of air pollutants in the atmosphere.
Figure 2. Concentrations of PM10 in 2020 and 2021 in relation to the EU daily limit value
Concentrations of PM10 in 2020:
- 20 reporting countries, including 15 EU Member States, registered concentrations above the EU daily limit value of 50 µg/m3
- 10 reporting countries, including 6 EU Member States, registered concentrations above the EU annual limit value of 40 µg/m3
- All 36 reporting countries registered concentrations above the WHO daily guideline of 45 µg/m3
- All reporting countries except Iceland registered concentrations above the WHO annual guideline of 15 µg/m3
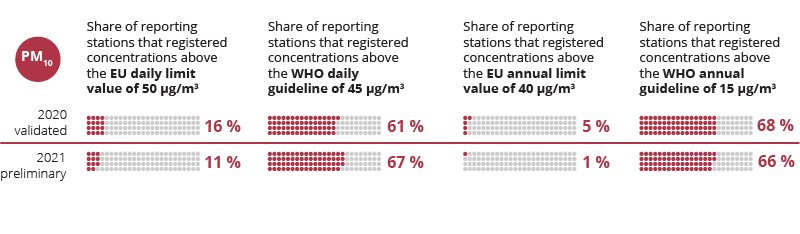
Concentrations of PM10 above the EU daily limit value were measured at 16% of monitoring stations, 84% of which were urban and 11% suburban.
The impact of the COVID-19 lockdown measures on the annual mean level of PM10 was limited, and no greater than a median reduction of 4% across all stations (ETC/ATNI, 2021/16). This may be because increased emissions from residential heating compensated for emission reductions in other sectors. While decreases in annual mean PM10 concentrations were measured predominantly at traffic stations, some other monitoring stations measured a clear increase. There was no clear geographical pattern across Europe. In fact, during April 2020, reductions of up to 35% were found at some traffic stations in Italy and Spain, although some background stations also showed an increase in their April 2020 concentrations (EEA, 2020).
Concentrations of PM10 in 2021:
- 16 reporting countries, including 12 EU Member States, reported concentrations above the daily limit value
- 8 reporting countries, including 5 EU Member States, reported concentrations above the annual limit value
- All 32 reporting countries reported concentrations above the WHO daily guideline
- All reporting countries except Iceland reported concentrations above the WHO annual guideline
PM2.5 stands for particulate matter with a diameter of 2.5 µm or less. These particles are emitted mainly from the combustion of fuels for domestic heating, industrial activities and road transport. As with PM10, they can also come from natural sources and can be formed in the atmosphere. Agricultural emissions of ammonia make a significant contribution to the formation of particulate matter in the atmosphere.
The highest PM2.5 concentrations were seen in northern Italy and some eastern European countries. As for PM10, the use of solid fuels is the main reason for the situation in central and eastern Europe, together with an older vehicle fleet. In northern Italy, the high concentrations are due to the combination of a high density of anthropogenic emissions and meteorological and geographical conditions that favour the accumulation of air pollutants in the atmosphere.
Concentrations of PM2.5 in 2020:
- 6 reporting countries, including 3 EU Member States, registered concentrations above the EU annual limit value of 25 µg/m3
- All 33 reporting countries, with the exception of Estonia, registered concentrations above the WHO annual guideline of 5 µg/m3
- All reporting countries registered concentrations above the WHO daily guideline of 15 µg/m3
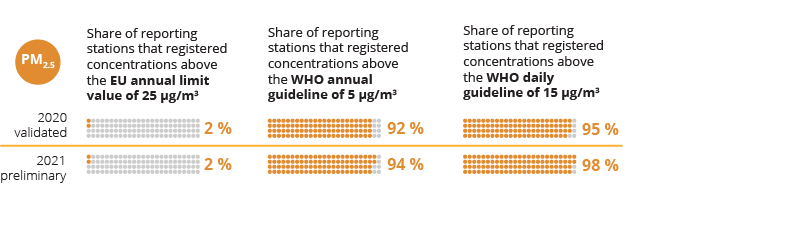
Concentrations of PM2.5 above the EU annual limit value were registered at 2% of monitoring stations, 69% of which were urban and 21% suburban.
The impact of the COVID-19 lockdown measures on the annual mean level of PM2.5 was limited, and no greater than a median reduction of 5% across all stations (ETC/ATNI, 2021/16). The average decrease in concentrations was greater at traffic monitoring stations than at urban and rural background stations. As for PM10, increased emissions from residential heating could have negated reductions in other sectors.
In 2020, all EU Member States met the exposure concentration obligation of 20 µg/m3, based on a 3-year average (2018-2020) measured at urban background stations, that was to be attained as of 2015 under the Ambient Air Quality Directive. In contrast, 5 Member States, (Bulgaria, Croatia, Poland, Portugal, and Romania) did not meet their national exposure reduction target, in relation to their Average Exposure Indicator for 2011 (for 2015 in the case of Croatia) level, set for 2020. This indicator assesses the long term exposure of the general population in urban areas.
Concentrations of PM2.5 in 2021:
- 6 reporting countries, including 3 EU Member States, registered concentrations above the EU annual limit value
- All 30 reporting countries registered concentrations above the WHO annual guideline
- All reporting countries registered concentrations above the WHO daily guideline
Ozone (O3) is a pollutant formed in the atmosphere when heat and light cause chemical reactions between nitrogen oxides and volatile organic compounds (VOCs), including methane. Emissions of these gases occur from anthropogenic sources and, in the case of VOCs, also biogenic. Ozone also is transported to Europe from other parts of the northern hemisphere and from the upper atmosphere. Meteorology plays an important role in the formation of air pollution and in interannual variation in concentrations, and this effect is especially significant for ozone.
Note: Data are presented here for 1 year only, not the average over a 3-year period as stated in the definition of the EU target value for O3
The highest concentrations in 2020 were found in central parts of Europe, some Mediterranean countries and Portugal. Despite 2020 being the warmest year on record in Europe, ozone levels were lower than in previous years. Two factors may play a role here. Firstly, high temperatures were recorded in winter and autumn, when ozone formation is less intense (CAMS, 2022). Secondly, emissions of ozone precursors, in particular NO2, fell during the COVID-19 lockdowns.
The decrease in ozone levels due to the COVID-19 lockdowns depends on the metrics used to measure ozone concentrations. For SOMO10[1], the median decrease was 5% across all stations, while for other health related metrics the decrease was lower (ETC/ATNI, 2021/16). Spain registered the biggest falls in ozone concentrations due to the COVID-19 lockdown.
Concentrations of O3 in 2020:
- 21 reporting countries, including 15 EU Member States, registered levels above the EU target value threshold of 120 µg/m3
- All 34 reporting countries[2] registered levels above the WHO peak season guideline of 60 µg/m3
- All 35 reporting countries registered levels above the WHO guideline of 100 µg/m3

The long-term EU objective for ozone of 120 µg/m3 was met at 19% of monitoring stations in 2020, with all 35 reporting countries, except Andorra and Latvia, reporting stations with concentrations above the long-term objective.
Note: Data are presented here for 1 year only, not the average over a 3-year period as stated in the definition of the EU target value for O3
Concentrations of O3 in 2021:
- 20 reporting countries, including 16 EU Member States, registered concentrations above the EU target value threshold
- All 33 reporting countries registered levels above the WHO peak season guideline
- All 33 reporting countries registered levels above the WHO short-term guideline
In 2021, the long-term EU objective for ozone was met at 20% of monitoring stations, with all 33 reporting countries registering concentrations above the long-term objective.
The main source of nitrogen dioxide (NO2) is road transport, which emits NO2 close to the ground, mostly in densely populated areas, contributing to population exposure. Other important sources are combustion processes in industry and energy supply.
The highest concentrations were found across Europe in bigger cities with a high traffic volume. The impact of the COVID-19 related lockdown measures during 2020 is clearly seen for this air pollutant, as its main source — road transport — was significantly reduced. In the 10 EU Member States most affected by the first wave of lockdowns, the average reduction in annual mean concentrations of NO2 ranged from 10% to 19% (ETC/ATNI, 2021/16). In France, Italy and Spain, NO2 annual mean levels fell by as much as 25% in large cities and 17% in rural areas. These reductions, estimated throughout the whole year, are smaller than those seen in April 2020 during the first lockdown. In the countries where lockdown measures were stricter, monthly concentrations decreased by up to 70% at traffic stations (EEA, 2020).
Concentrations of NO2 in 2020:
- 8 reporting countries, including 7 EU Member States, registered concentrations above the EU annual limit value of 40 µg/m3
- All 36 reporting countries registered concentrations above the WHO annual guideline of 10 µg/m3
- All reporting countries registered concentrations above the WHO daily guideline of 25 µg/m3
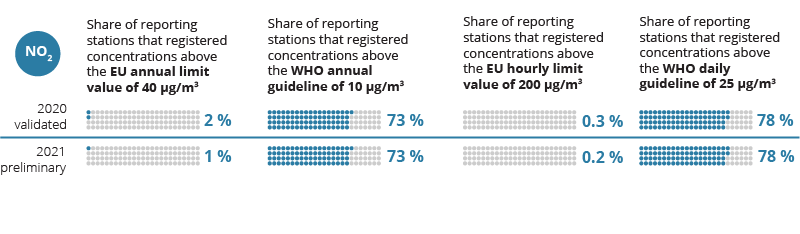
Concentrations of NO2 above the EU annual limit value were registered at 2% of all monitoring stations, 69% of which were traffic stations.
Annual mean NO2 concentrations in 2020 were the lowest on record, with the fewest exceedances of the EU annual limit registered across Europe. NO2 concentrations at 11% of the traffic stations in (ETC/ATNI, 2021/16) fell from above the EU annual limit value, in a business-as-usual scenario, to below the EU annual limit value as a result of the COVID-19 measures.
Concentrations of NO2 in 2021
- 8 reporting countries, including 7 EU Member States, registered values above the annual limit value
- All 35 reporting countries registered values above the WHO annual guideline
- All reporting countries registered values above the WHO daily guideline
Concentrations of NO2 above the annual limit value were registered at 1% of monitoring stations, all of which were traffic stations.
Benzo[a]pyrene (BaP) is a carcinogenic pollutant emitted mainly from the combustion of coal and wood for heating and, to a lesser extent, from the combustion of agricultural waste.
The highest concentrations were found in eastern Europe, where the use of coal and other solid fuels for residential heating is widespread.
Concentrations of Benzo[a]pyrene in 2020:
- 11 out of 27 reporting countries, all of which were EU Member States, registered values above 1.0 ng/m3
Concentrations above 1.0 ng/m3 were registered at 27% of the reported monitoring stations, the majority of which were urban (79%) or suburban (15%).
Concentrations of sulphur dioxide (SO2) in 2020:
-
5 out of 36 reporting countries, including two EU Member States, registered levels above the EU daily limit value of 125 µg/m3
-
16 countries registered values above the WHO daily guideline of 40 µg/m3 [3]
In 2020, concentrations above the EU daily limit value were registered at 1% of reporting monitoring stations.
In 2021, concentrations of SO2 above the EU daily limit value were registered in three out of 34 reporting countries, including two EU Member States. In the same year, concentrations above the WHO daily guideline were registered in 13 countries.
Concentrations above EU target/limit values, were registered in 2020 for the following:
-
Carbon monoxide in two stations located in two non-EU Member States, out of 34 reporting countries
-
Arsenic in seven stations located in three EU Member States, out of 27 reporting countries
-
Cadmium in one station located in one EU Member State, out of 28 reporting countries
-
Nickel in two stations located in two EU Member States, out of 27 reporting countries
None of the 27 countries that reported data had values above the EU limit value for lead.
None of the 29 countries that reported data had values above the EU limit value for benzene.

Document Actions
Share with others