What does the map of ecosystem types provide?
The map has two main elements:
- the terrestrial part, which also includes rivers and lakes;
- the marine part, which includes marine water bodies and seabed mapping.
Mapping terrestrial ecosystems and habitats
Mapping is based on linking the non-spatially descriptive EUNIS habitat information with spatially explicit information (described in ETC/BD, 2018).
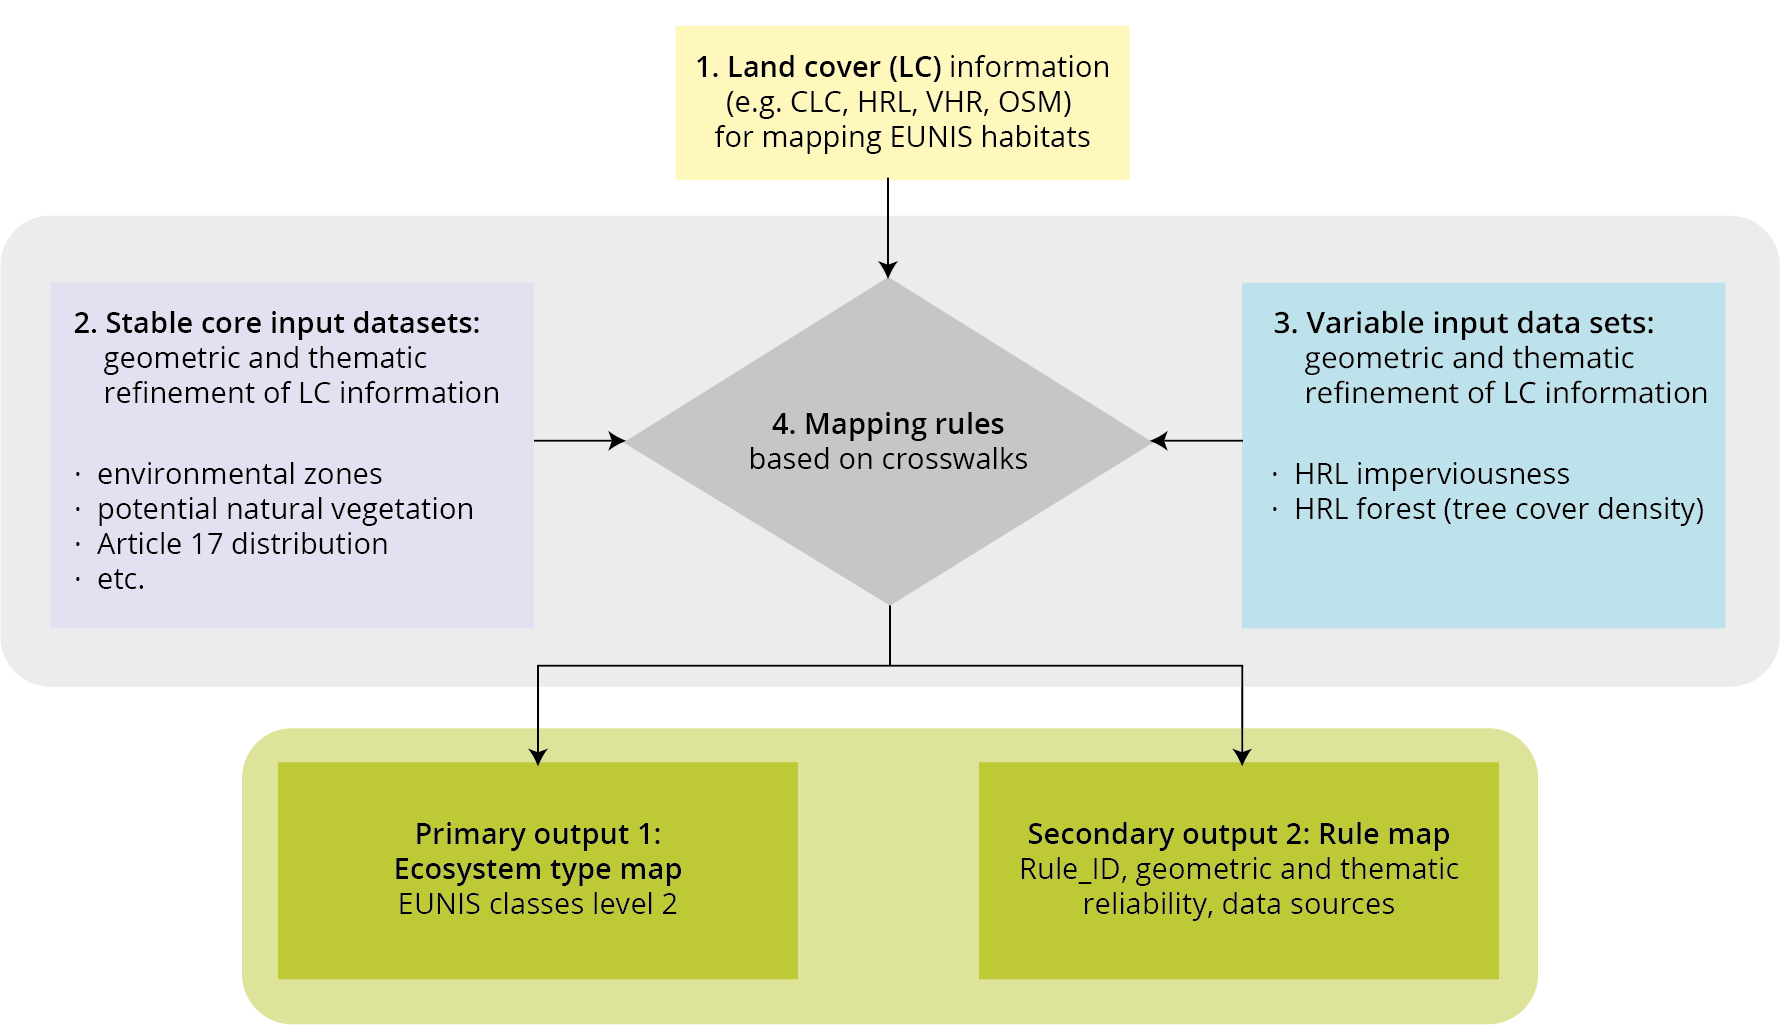
The basic input of spatial information for the mapping exercise is the Corine Land Cover (CLC) data set with reference year 2012. This map is further refined with other products in the Copernicus land monitoring service portfolio, mainly the high-resolution layers (HRLs), area of soil sealing (imperviousness), forest cover, grassland and wetness index, and the very high resolution layers (VHRs), Urban Atlas, riparian zones and Natura 2000. In addition, the latest version of OpenStreetMap (OSM) is used.
A second set of input data contains maps of environmental zones and potential natural vegetation and information from reporting for the Habitats Directive, as described in ETC/BD (2018).
The third information layer consists of variables on individual land cover classes such as degree of sealing (imperviousness) and tree cover density (forest) also provided by Copernicus.
Finally, the environmental conditions under which each habitat exists, and that are documented in the EUNIS database, are applied as mapping rules on the spatial data set. The mapping rules are based on crosswalks between the EUNIS habitat description and the available spatially explicit data. They have been validated using the plots of the European Vegetation Survey, which comprises about 1 million vegetation plots (ETC/BD, 2018).
The produced ecosystem type map represents the terrestrial EUNIS habitat classes on level 2 at 100 m × 100 m spatial resolution grid and covers the EEA-39. The spatially explicit input data are not always sufficient to allow precise delineation of each EUNIS habitat. In addition, the input information is not fully homogeneous in its spatial and thematic accuracy. Therefore, the geometric and thematic reliability of each EUNIS habitat was calculated in relation to the spatial input information expressed as a mapping rule (Figure 1). Both maps are available online.
Note: CLC, Corine land cover; HRL (Copernicus) high resolution layer; VHR (Copernicus) very high resolution layer; OSM open street map.
Source: ETC/BD (2018).
Mapping marine ecosystems and habitats
Marine ecosystems include the seabed and the water column, which is divided into different depths. Of particular importance is the zone close to the surface, which receives light (the photic zone) and which contains most of the primary productivity that supports marine food webs, including those in the deeper parts of Europe’s seas. Salinity is also an important physico-chemical factor for species and their habitats in transitional and coastal waters (Howell, 2010).
Mapping marine ecosystems and habitats includes the following:
- Seven layers of water column depths are delineated for each of the European sea regions. These are based on bathymetry data, the measurements of the depth of water in oceans and the EUNIS classification.
- These layers may be combined with six classes of seabed information provided by the European Marine Observation and Data Network (EMODnet).
- The combination of water column layers and seabed information results in up to 126 classes for each sea region.
- To simplify the visualisation, the information on water column and seabed is provided separately for each sea region. The combination of these two elements allows individual maps to be produced for marine ecosystems.
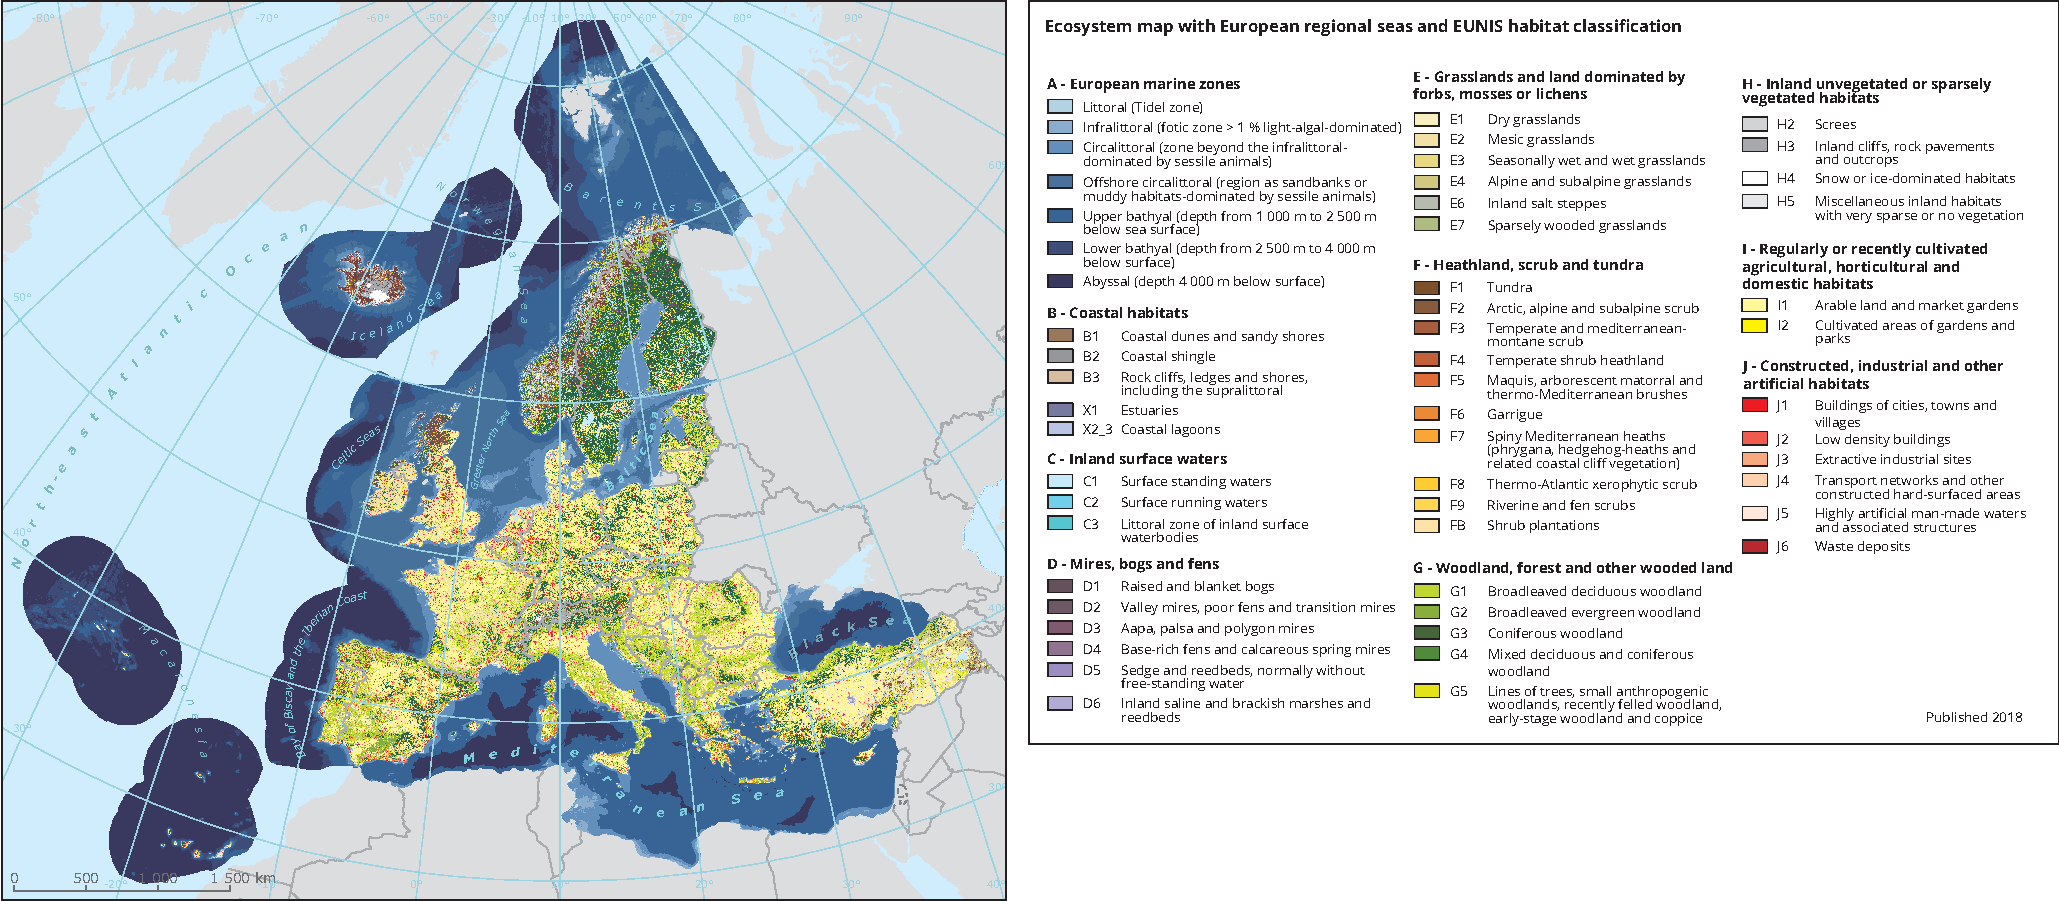
Figure 2 illustrates the distribution of ecosystems, habitats and sea zones and seabed types. The data layers can be downloaded together with additional spatially explicit information about the geometric and thematic reliability of the individual delineation of each habitat and the spatial resolution of the input data.
Figure 2.a: Terrestrial, freshwater ecosystem types and sea zones 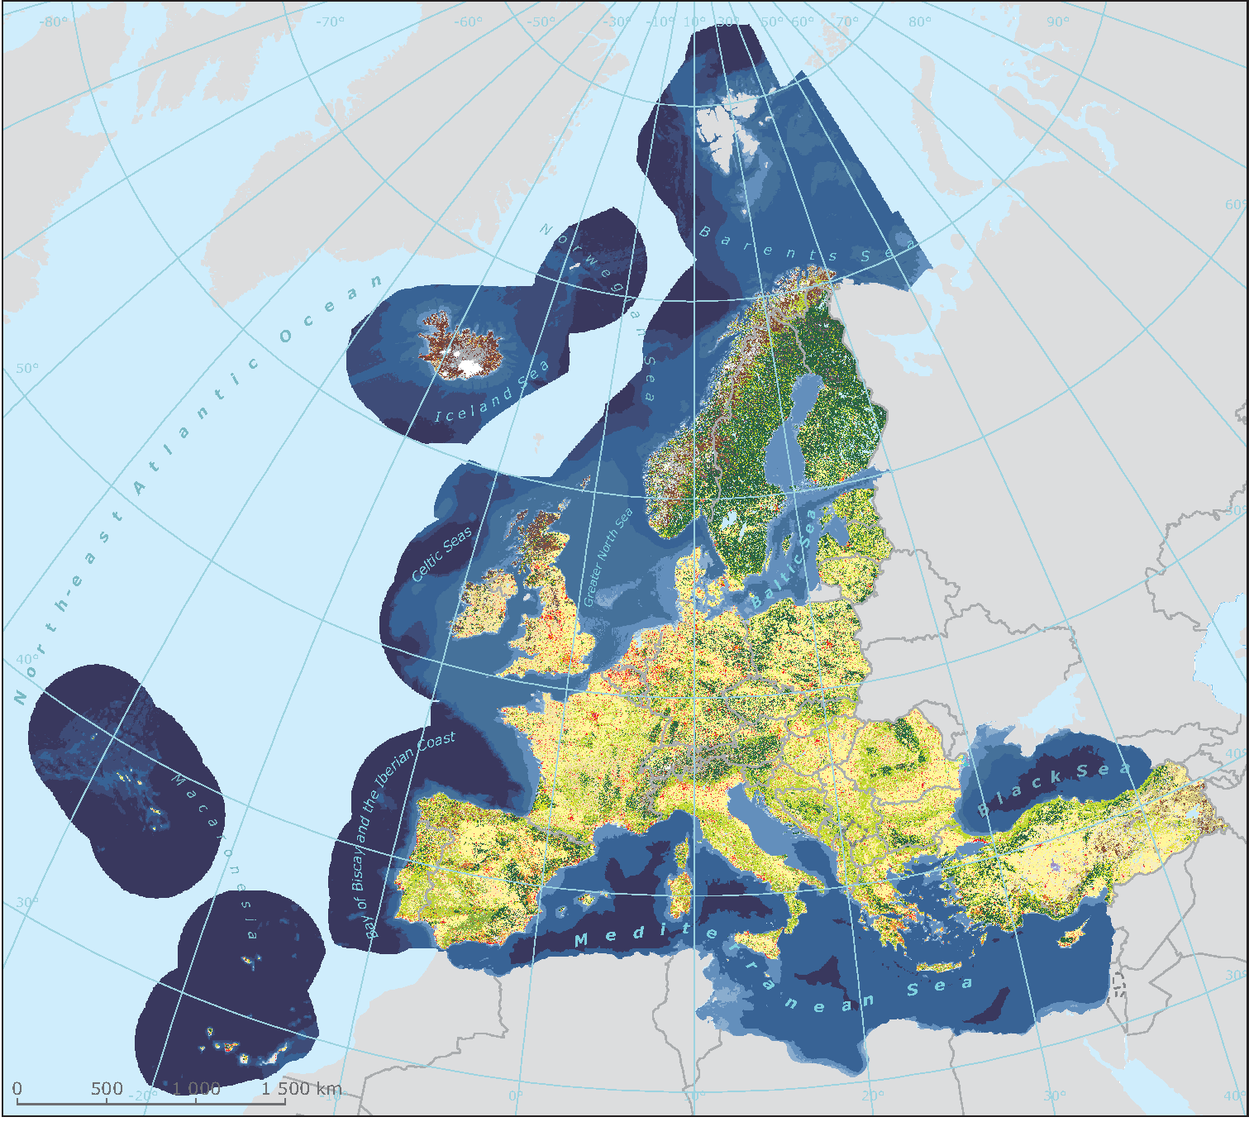
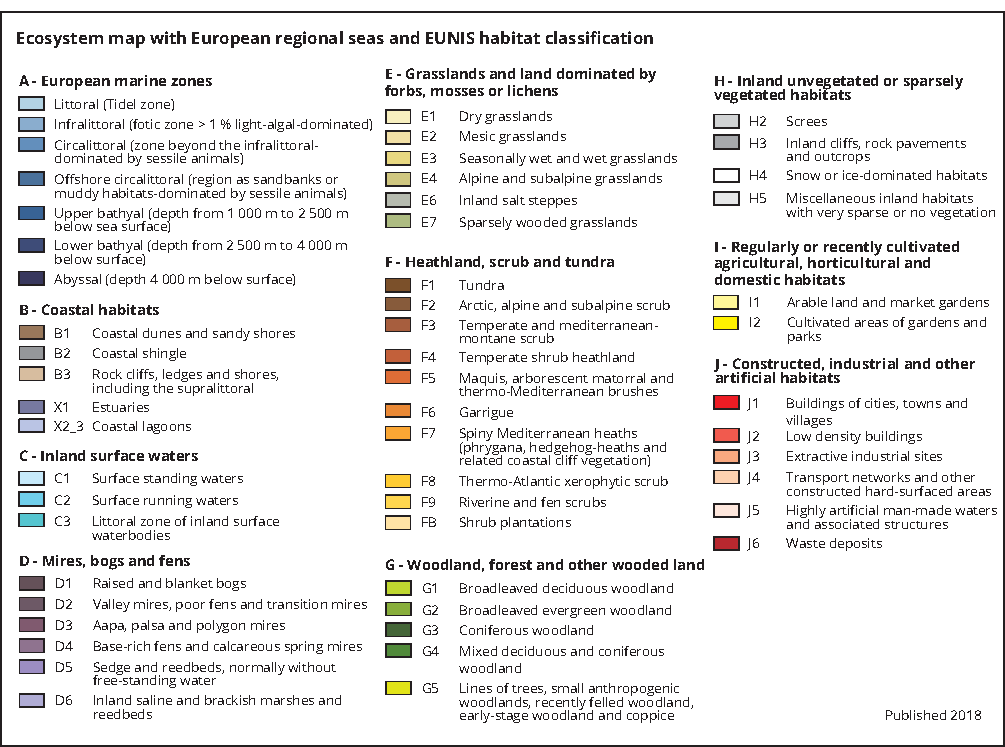
Figure 2.b: Seabeds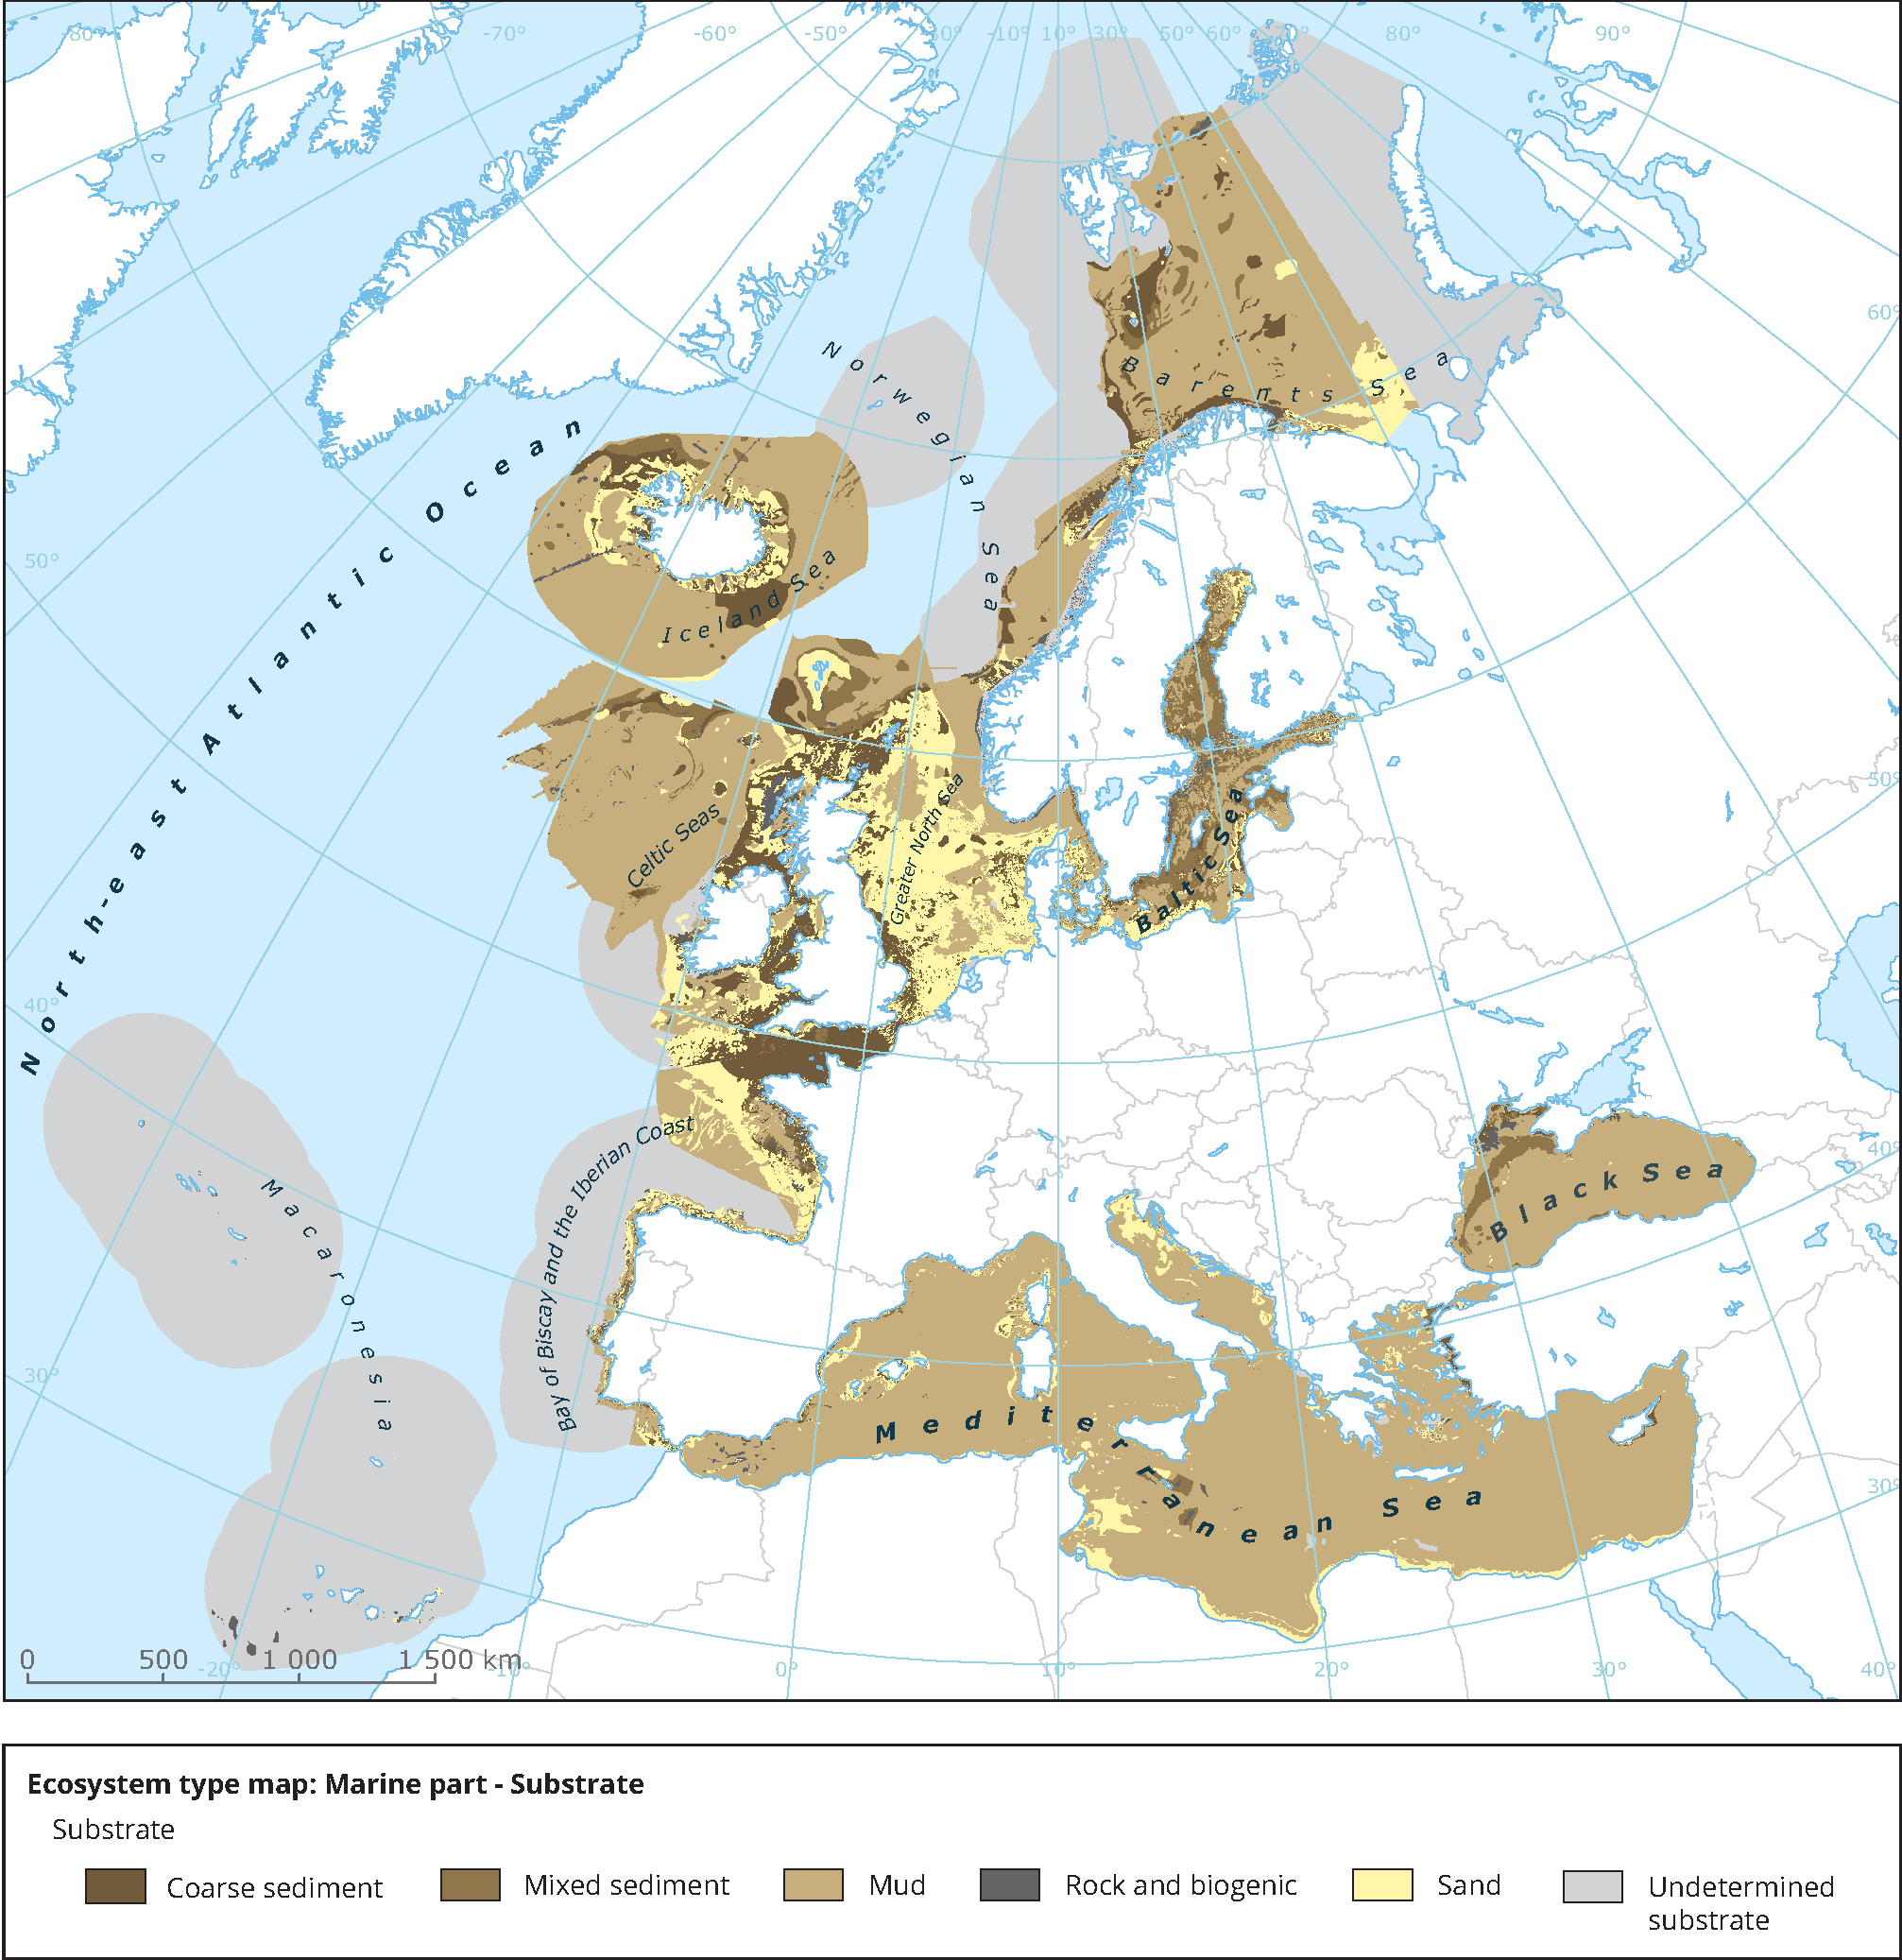
Sources: ETC/BD(2018), marine part provided by ETC/ULS; dateset ecosystem types;
Download figures in high resolution: Figure 2.a; Figure 2.b.
This version of the map was created to support the development of the knowledge base for the final evaluation of the EU biodiversity strategy to 2020. It is part of the analytical framework developed to assess ecosystem condition, as documented in Maes et al. (2018).
In combination with the information reported in the Habitats and Birds Directives, the Water Framework Directive and the Marine Strategy Framework Directive, more detailed information on ecosystem condition will become available. This can be combined with data on pressures, such as land cover and land use change, land management, nutrient and pollution load, climate change and invasive alien species, to identify areas where ecosystems and habitats are at risk or where their condition may improve.
Combining ecosystem distribution data with pressure data creates an important assessment tool to identify what measures are most important to keep ecosystems in good condition and improve their capability to provide services.
What are the next steps to improve the ecosystem map?
With Sentinel satellites in place, the Copernicus programme is providing not only more detailed data with higher spatial and temporal resolutions but also a series of additional and more detailed thematic information layers. These will allow further enhancement of the ecosystem type map.
More detailed land cover/land use maps are expected to be available from 2022, together with a fully revised EUNIS habitat classification, which will include modelled habitat distribution maps. In addition, better access to spatially referenced vegetation and habitat distribution data will allow a more ecologically accurate interpretation of remote sensing data sets.
When improved satellite and supporting data are available and updated regularly, operational mapping can be used for ecosystem extent accounting (EEA, in press). In parallel, integrating more detailed Member States’ mapping and assessments will be investigated to improve delineation of habitats, especially in areas of high uncertainty. Overall, this process should lead to more detailed information at European level on how ecosystems and habitats are distributed across Europe and how their extent and condition change. It is also a way to monitor and interpret ecosystem resilience.

Document Actions
Share with others