All official European Union website addresses are in the europa.eu domain.
See all EU institutions and bodiesAn official website of the European Union | How do you know?
Environmental information systems
EN
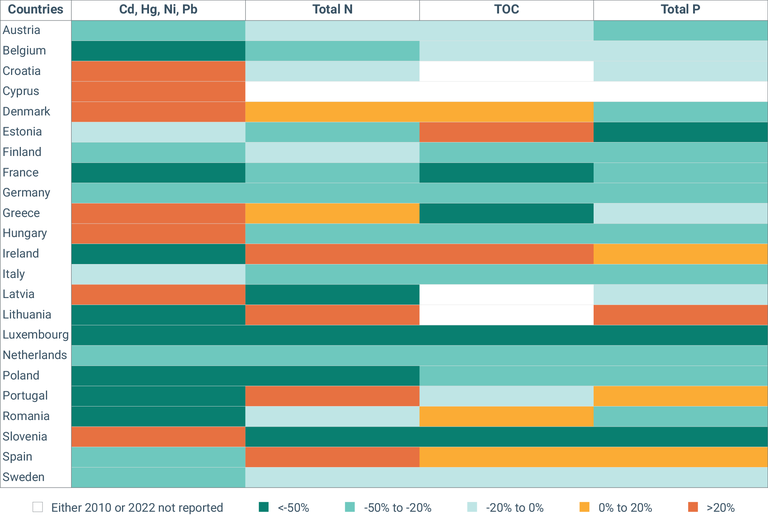
The table show the top five emission reduction changes in pollutant releases into water in EU-27 Member States from 2010 to 2022.
Loading