All official European Union website addresses are in the europa.eu domain.
See all EU institutions and bodiesAn official website of the European Union | How do you know?
Environmental information systems
EN
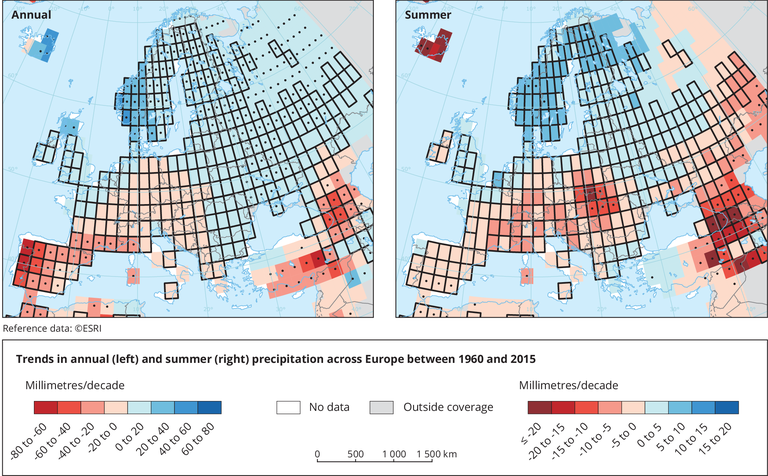
Grid boxes outlined in solid black contain at least three stations and so are likely to be more representative of the grid box. Significant (at the 5 % level) long-term trend is shown by a black dot (In the map above, this is the case for all grid boxes). The map below shows average annual air temperatures over Iberian Peninsula and Scandinavia, respectively.
Loading