All official European Union website addresses are in the europa.eu domain.
See all EU institutions and bodiesAn official website of the European Union | How do you know?
Environmental information systems
EN
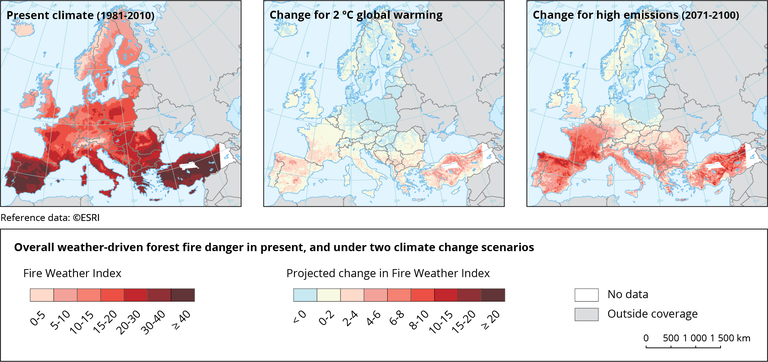
Climate change assessment of the Fire Weather Index (FWI) aggregated component, computed daily from 1980 to 2100 for five models (see Table 4 of de Rigo et al., 2017 https://doi.org/10.2760/13180 ). The daily FWI is computed for each scenario realisation based on a corresponding model. The entire time series has been estimated (from the end of the control period, the scenario RCP8.5 has been used) and the 90 % quantile of each time period has been computed. The median of the five model ensemble is shown for each period.
Loading