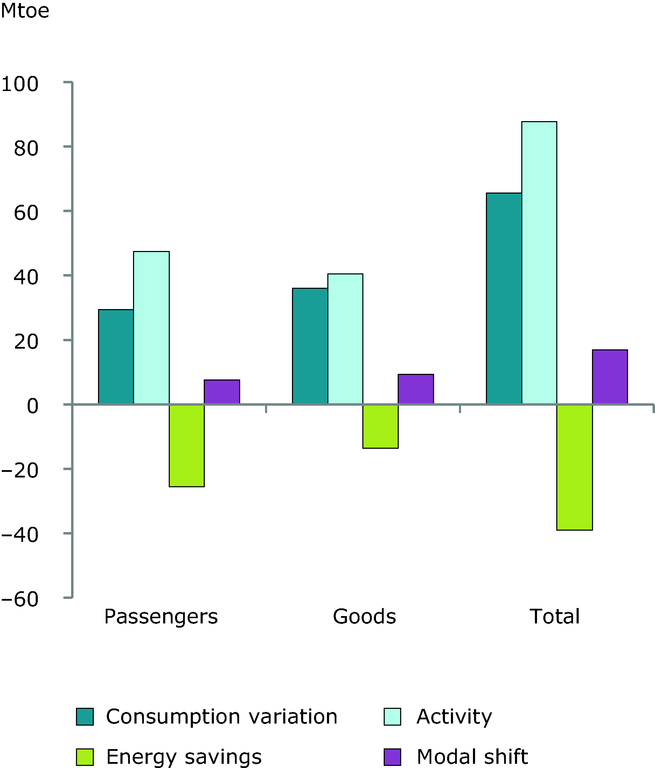
Breakdown of the energy consumption variation for transport in the EU-27 (1990-2008)
Chart (static)
The energy consumption variation of passenger and goods transport is broken down into 2 explanatory effects: activity effect (increase in traffic) and global energy savings (change in specific energy consumption per unit of traffic). Air transport excluded; Activity: impact of increase in traffic; modal shift : decrease in the share of public transport in total traffic; energy savings: measured from the reduction in specific consumption per unit of traffic.
The energy consumption variation of passenger and goods transport is broken down into 2 explanatory effects:
activity effect (increase in traffic)
global energy savings (change in specific energy consumption per unit of traffic)
The calculations refer to the definition used in the ESD Directive and excludes air transport
Activity effect = ∆ T i, (t,t-1) * SCT i, t-1
T : Traffic (in passenger-kilometer or ton-kilometer),
SCT: Specific consumption per unit of traffic (goe/tkm or goe/pkm),
i= passenger or goods
Global savings effect = T i, t * ∆SCT i,(t,t-1)
(savings are <o), Global savings are actually the sum of savings by each mode individually and savings due to modal shift
Global savings effect = ∑ savings by mode i, j + savings from modal shift i
i= passenger or goods
j= transport mode (car or bus or rail for passenger; road, rail or water for goods)
Sum of savings by mode for passengers are the sum of the savings calculated for cars, bus and rail ; savings for goods are the sum of savings calculated for road, water and rail separately
Savings by mode j , SAVj, are calculating as follows SAV j = ∆ SCT j * T j, t
Savings from modal shift for passengers are <0 abd represent real savings if there is an increase in the share of public transport in total traffic for passenger
Savings from modal shift for goods are <0 if there is an increase in the share of rail and water in total traffic for goods