Introduction
Biodiversity sustains life on Earth. It provides food, regulates the climate, purifies water, encourages pollination and much more. Biodiversity, like much of nature, is also treasured for its recreational and aesthetic values. One of the major drivers of biodiversity loss and decline in Europe and worldwide is pollution. Pollution puts pressure on freshwater, marine and terrestrial ecosystems, the functions they maintain and the services they provide — all of which are vital for life on Earth.
The types of pollutants that affect ecosystems are wide ranging — from human-made chemical products, nutrients (e.g. nitrogen) and microplastics to ambient sources such as noise and light (as explained in the ‘Signal’ on light pollution).
Pollution can originate from both ‘point‘ sources, such as industrial installations and urban wastewater treatment plants, and ‘diffuse’ sources, such as agriculture and the transport sector (EEA, 2020). The linear (take, make, use, dispose) production and consumption systems that drive Europe’s society and economy tend to exacerbate pollution and its impacts on natural habitats, as detailed in the zero pollution section on production and consumption.
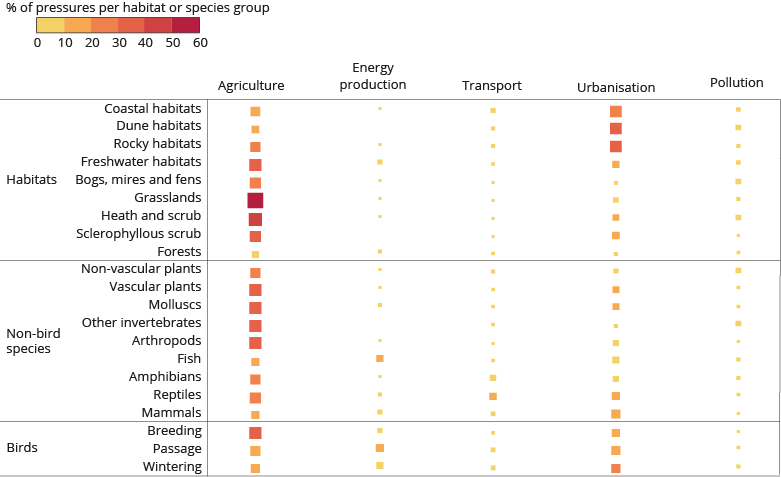
Agriculture contributes significantly to habitat and species harm, with agricultural activities accounting for 48% of all pollution-related pressures on habitats and species in Europe (Figure 1). Other significant sources of pollution pressure include urbanisation (21%) and mixed pollution sources that cannot be attributed to a specific origin or activity (28%) (EEA, 2020). Urbanisation includes urban development; the use of residential, commercial, industrial and recreational areas; and dispersed recreational and leisure activities.

Note: The size of the squares and the shade of orange reflect the extent of the pressure exerted by the various activities and economic processes: the larger and darker the squares, the higher the percentage of pollution-related pressure the category accounts for. The category 'Pollution' relates to a small number of sources that are potentially significant but do not fit into any of the other categories (e.g. specific local pollution sources). In general, however, pollution sources are included in a specific category where possible. For example, the use of plant protection products is included in the ‘agriculture’ pressure category because they are directly relevant to that category.
Source: EEA (2020). Based on reporting by EU Member States over the period 2013 to 2018.
The EU’s zero pollution action plan
The EU’s zero pollution action plan aims to address key pollution issues that negatively affect the environment and human health. It presents a vision for 2050 where pollution is reduced to the extent that it is no longer harmful. Prevention is one of the core principles underpinning the zero pollution action plan. By preventing pollution at its source, we can eliminate the risks to human health and the environment. Further information on the role of the EEA in zero pollution monitoring is available on the zero pollution monitoring home page.
Zero pollution package 2022 – new rules proposed for cleaner air and water
To strengthen the delivery of the zero pollution objectives the Commission recently proposed a zero pollution package that addresses water and air pollution. The package includes proposed new rules on water pollution and a revision of the Urban Wastewater Treatment Directive.
New rules on surface water and groundwater pollution:
The proposed changes affect the Water Framework Directive, as well as the Environmental Quality Standards Directive for surface waters, and the Groundwater Directive.
Proposed changes to requirements for surface waters are listed below.
- Adding 23 new substances (including pesticides, pharmaceuticals and industrial chemicals), as well as a new group of 24 PFAS, to the list of priority substances to be monitored in surface waters. Member States must ensure that the environmental quality standards for all priority substances are met in order to achieve good chemical status.
- Introducing stricter environmental quality standards for priority substances in surface waters for 14 substances.
- Developing a methodology to monitor microplastics and antimicrobial resistance genes in surface waters, with a view to including them on the watch list of substances for which EU-wide monitoring data are to be gathered for the purpose of supporting future prioritisation.
- Improve the monitoring of chemical mixtures to better assess combination effects and take account of seasonal variations in pollutant concentrations.
Proposed changes to requirements for groundwater include:
- Adding two antibiotics and the group of 24 PFAS to the list of substances under the groundwater directive for which quality standards are set as the basis for assessing groundwater chemical status.
Importantly the changes will also allow for the easier inclusion of new pollutants in the future, and will introduce more frequent reporting of monitoring and status data by Member States.
Revision of the Urban Wastewater Treatment Directive:
The proposed directive aims to further reduce pollution from urban wastewater by:
- Setting stricter standards for nutrients and new standards for micropollutants;
- Establishing new monitoring requirements for microplastics;
- Setting up a system of producer responsibility targeting pharmaceutical and personal care products to cover the additional treatment costs for micro-pollutants;
- Reducing the population equivalent threshold to 1,000 to trigger the application of standard treatment requirements to urban wastewater treatment plants that service smaller municipalities;
- Establishing monitoring requirements for antimicrobial resistance in the outlets of urban wastewater treatment plants for all agglomerations of 100,000 inhabitants.
- Establishing integrated water management plans in large cities, in particular to manage heavy rainfall events; and
- Reducing energy use and greenhouse gas emissions in the sector.
Pollution and ecosystems: summary of findings
Figure 2 presents an overarching assessment of the progress made in reducing pollution and meeting relevant EU policy objectives/targets for freshwater, marine, air and soil pollution impacts on ecosystems. Further information on each of these topics is presented in the relevant sections. A collection of zero pollution ‘Signals’ is also available; these provide supplementary information highlighting other important or emerging issues related to the zero pollution ambitions and ecosystems.
Guidance for reading the summary analysis:
The infographic above summarises the overall findings described in each of the sections on ecosystems and freshwater pollution, marine pollution, air pollution and soil pollution. The analysis considers two, distinct aspects:
- whether the recent trend in pollution is positive, negative or uncertain.
- the current 'distance to target', based on an assessment of the current trends or status, and whether or not the EU is on track to achieve the defined zero pollution targets for 2030 and/or other relevant policy targets.
The analysis is based on a combination of (1) available indicators and data, and (2) expert judgement. Further details of this analysis are included in each of the sections (on marine, freshwater, air and soil pollution), which summarise the rationale behind the findings and indicate the robustness of available data.
Cover image source: © Panagiotis Dalagiorgos, Well with Nature /EEA


Document Actions
Share with others