Indicator 10: Access to basic services
|
Urban sprawl, increased car availability and the concentration of
working places and shopping facilities in out-of-town locations have resulted
in continuing increases in journey length for all purposes, but particularly
for commuting journeys. Access to basic services is becoming more and
more dependent on car transport.
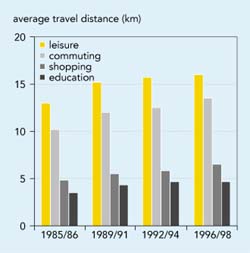
Figure 3.2: Average journey lengths by purpose (United Kingdom)

Source: Department of the Environment, Transport and the Regions
(United Kingdom, 1999)/p>
Objectives
- Improve access to employment, services and leisure activities by environment-friendly
transport.
- Reduce the need to travel.
Definition
Average journey length and time per person,
by mode and purpose (work/education, business, shopping, leisure, holidays).
Note:
Average journey lengths and times provide simple measures of the ease
with which people have access to basic services. They are determined by
spatial planning (the distribution of socio-economic activities and home
location) together with the availability of public and private transport
infrastructure.
|
Policy and targets
EU transport policy has in recent years focused on the
concept of sustainable mobility rather than accessibility. Reducing the demand
for mobility (e.g. by a better integration of transport planning and spatial
planning) has attracted less attention.
Some countries (and cities) have taken initiatives to
improve coordination of regional, urban and transport planning by increasing
accessibility while reducing the demand for car transport. This can be done,
for example, by mixing urban functions, introducing zoning and parking policies
and improving public transport.
- The Dutch Government has adopted a policy aimed at
concentrating employment-intensive land use around public transport routes
and interchanges. The target (by 2000) is to keep the ratio of journey-to-work
travel times by public transport compared to private car below 1.5 on all
main commuter routes.
- The UK government has a policy of reducing demand
for transport through appropriate land-use and development planning. The government
encourages local authorities to improve accessibility to help determine the
location of new development and the need for improved public transport infrastructure.
Commission information-exchange initiatives such as
the Car-Free Cities network, the European Local Transport Information Service
and the database on Urban Management and Sustainability are contributing to
the spread of good practice. Another important framework is the action plan
of the ESDP, which was recently adopted (CEC, 1999). This aims to strengthen
the link between spatial policy and transport policy (in particular the TEN),
and promotes the assessment of the spatial impacts of Community policies and
territorial impact assessments.
|
Box 3.1: The Dutch ABC location policy
The ABC policy is a commercial and industrial
demand-side planning initiative, whose objective is to find the proper
location for each activity, and to encourage the use of public transport.
Firms are classified according to modal access needs (as indicated in
the table below), and their location is then determined to match these
mobility needs:
- Type A firms are expected to locate in areas
very well served by public transport.
- Type B firms in areas well served by public
transport and fairly easily accessible by car.
- Type C firms in areas where road and motorway
access is particularly important.
| |
Type A firms
|
Type B firms
|
Type C firms
|
|
|
Space requirement per worker
|
< 40 m²
|
40-100 m²
|
> 100 m²
|
|
Space requirement per visitor
|
<100m²
|
100-300 m²
|
>300 m²
|
|
Dependence of business activities on use of car
|
<20 % of personnel must use car
|
20-30 % of personnel must use car
|
>30 % of personnel must use car
|
|
Importance of motorway connections for goods transport
|
hardly important
|
possibly important
|
important
|
|
|
The national government also intends to
use fiscal and tax leverage to ensure that firms comply with these
guidelines, but many of these mechanisms are not yet in place. The
municipal governments, as planning authorities, have more influence
on land supply than demand. As a result, only limited enforcement
of the national ABC policy has been possible.
Source: OECD/ECMT workshop:
Land-use for sustainable urban transport
|
|
Findings
Although some countries collect information
on this indicator, no EU-wide data is yet available. This assessment is therefore
based on case studies and a literature search.
A study (Schipper, et al.,1995) has compared
travel surveys from the US and a number of European countries (Figure 3.3).
It shows that:
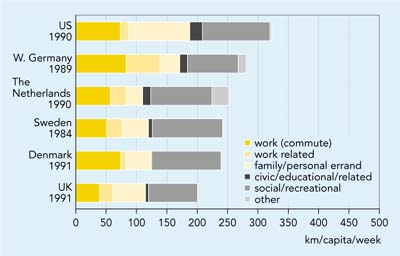
Figure 3.3: Passenger travel by purpose (selected countries
and years)
Source: Schipper. et al., 1995
- work travel (mostly commuting, but some trips within work) accounts for
20-30 % of travel; services, civic, educational, and family business
accounts for about 25 % (except in the US, where the share was higher);
leisure (including culture, sports, outdoors, etc.) make up the rest.
- the average trip length by car is about 13-15 km for all European countries
studied. Even though cars are increasingly built for higher speeds and longer
trips, they are still used mainly for local transportation (about 80 %
of all trips are less than 20 km and 60 % are less than 10 km). Since
car trips are about the same length in the US as they are in the Netherlands,
the higher US km-per-capita figures arise from more trips per person.
- In the UK, the length of the average commuting journey increased from 10
km in 1995/1986 to 13 km in 1996/98 %. An increasing number of commuting
journeys are made by private car and fewer by public transport. Cars account
for around 59 % of all journeys, and for 71 % of commuting trips.
|
The length of the average shopping journey in UK increased from 4.2 km
in 1975/76 to 6.2 km in 1996/98. This is a result of the growth and success
of out-of-town shopping centres and retail parks. The average education
trip increased from 3.2 km in 1975/76 to 4.4 km in 1996/98.
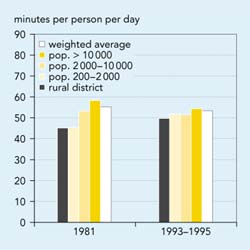
Figure 3.4 Daily travelling time per person (Denmark)
Source: The Danish ministry of transport
Note: data refers to working days
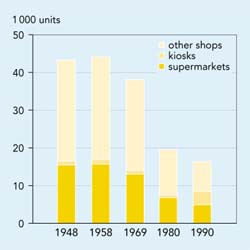
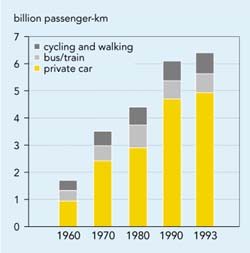
The relationship between socio-economic activities and transport volume
is illustrated by shopping patterns in Denmark. Between 1960 and 1993
the number of shops decreased by 60 %, while shopping-related transport
increased by a factor of 3.8. Shopping-related car transport increased
even more . by a factor of seven. Thus the concentration of shops into
larger units led to increases in transport volumes (Figures 3.5 and 3.6).
Figure 3.5:
Number of convenience goods shops, Denmark, 1948-1990
Source: Danish Technical University, 1996
National travel surveys in the UK, Germany, Switzerland, and the Netherlands
show that citizens spend on average about 75 minutes per day travelling,
made up of 3 trips of 25 min per person per day (1998 DG Transport fact
sheets). In 1996, average time spent commuting to and from work in the
various countries ranged from 23 minutes per day in Italy to 46 minutes
in the UK.
Data from Denmark shows that the time budget for travelling has remained
more or less constant over time, although earlier differences between
urban and non-urban areas have levelled out.
Figure 3.6:
Transport for convenience goods shopping, Denmark, 1960 to 1993
Source: Danish Technical University, 1996
|
|
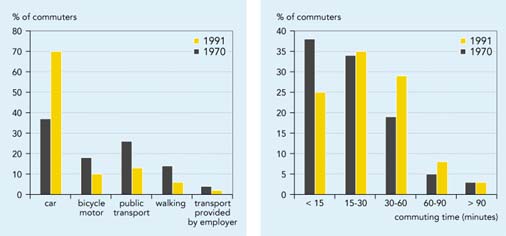
Box 3.2:Trends in commuting patterns in Belgium
In 1991, 3.2 million people in Belgium commuted to work . an increase
of 0.5 million since 1970. This was due, amongst other things, to increasing
urban sprawl and more double-income families. The car had become the predominant
commuting mode . seven out of ten employees, more than twice the number
in 1970, commuted by car, or shared a colleague. s car. Public transport,
cycling and walking trips decreased dramatically, both in absolute and
in relative terms. Average car speeds were however lower because of increased
congestion, and commuting distances had increased as a result of urban
sprawl. In 1981, commuters took on average 24 minutes to reach their place
of employment, but in 1991 they took 32 minutes. In 1991 the average commuting
distance was 17.6 km, but 50 % of journeys were less than 10 km.
Car-pooling had increased (from 5.9 to 8.9 %), but had not yet achieved
a significant breakthrough.
Figure3.7: Trends in commuting patterns in Belgium
Source: Volkstelling NIS, Nieuwsbrief Steunpunt werkgelegenheid, Arbeid en Vorming, 1999 |
Future work
- More in-depth studies of the concept of, and criteria
for, . sustainable accessibility. are needed. This should allow a better accessibility
indicator to be defined which would say more about the links between factors
such as land use and car ownership.
- In future, the indicator will need to be differentiated
geographically, e.g. distinguishing urban/rural accessibility problems and
showing regional differences.
- The indicator should enable analysis of changes over
time in average journey lengths, by purpose and mode, in order to assess changes
in access to basic services and the reasons behind increases in transport
demand.
- In several Member States regular travel surveys are
carried out to collect information about trip purpose, mode and length. Such
data should be harmonised and combined at the EU level. Standard definitions
of journey purposes are needed, e.g. distinguishing between commuting (including
education), shopping and leisure. Data on concentration of shops and working
places should also be collected.
Data
|
Average time spent commuting to and from work,
1996
UNIT: minutes
|
|
Member State(minutes per day)
|
B
|
DK
|
D
|
EL
|
E
|
F
|
IRL
|
I
|
L
|
NL
|
A
|
P
|
FIN
|
S
|
UK
|
EU15
|
|
Time
|
39
|
38
|
45
|
40
|
33
|
36
|
40
|
23
|
40
|
44
|
36
|
33
|
41
|
40
|
46
|
38
|
| Source:
Eurostat |

Document Actions
Share with others