Ozone-depleting substances (ODS)
ODS are substances, mainly compounds containing chlorine and/or bromine, that reach the stratosphere of the Earth and whose breakdown products react with the stratospheric ozone. This reduces the concentration levels of ozone in that region of the atmosphere (commonly known as the ozone layer) and thus the capacity of the atmosphere to filter ultraviolet light. Most known ODS are regulated under the Montreal Protocol.
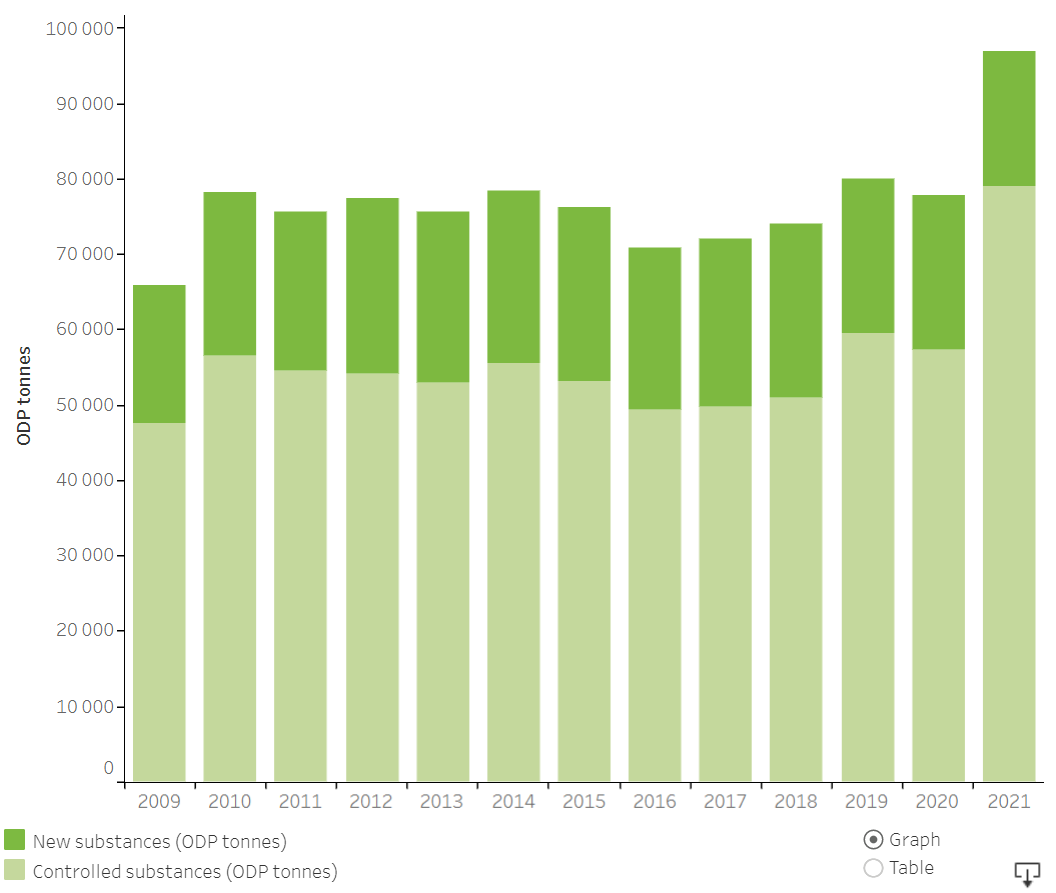
Controlled substances
Controlled substances are ODS that are listed in Annex I of the Ozone Regulation and are subject to the reporting obligation of Article 7 of the Montreal Protocol.
Mixtures
The term ‘mixtures’ refers to gas mixtures consisting of multiple substances, at least one of which is a controlled substance. Destruction facilities are required to report the quantities of individual substances destroyed each year. In certain cases, however, companies were only able to report on the destruction of mixtures of controlled substances with an unknown composition. Therefore, these mixtures are not included in the data presented in this online data viewer and are not reported under the Montreal Protocol.
New substances
The term ‘new substances’ refers to the five additional substances covered by the EU Ozone Regulation that are not included within the scope of the Montreal Protocol: halon 1202, n-propyl bromide (n-PB), ethyl bromide (EB), trifluoroiodomethane (TFIM) and methyl chloride (MC). Companies in the EU are obliged to report on the import, export and production of these substances in line with the Ozone Regulation’s higher level of ambition than that of the Montreal Protocol. New substances should not be confused with virgin substances (see below).
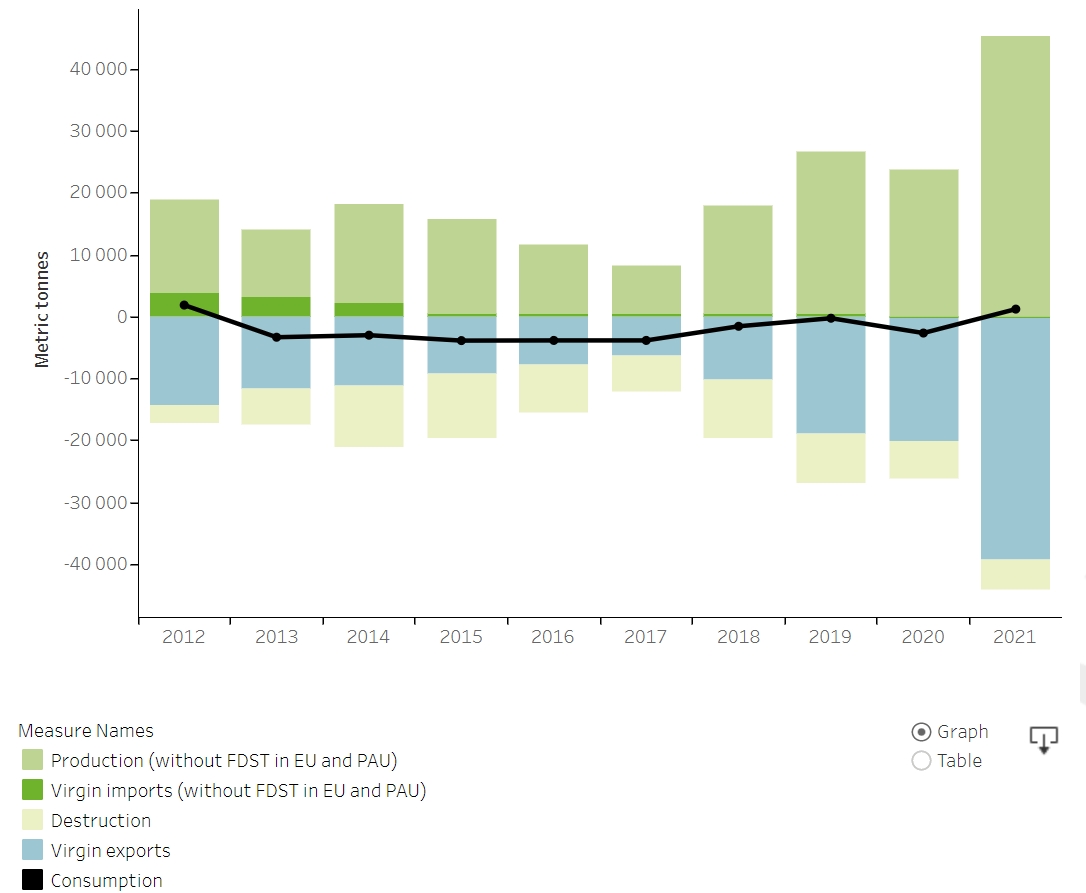
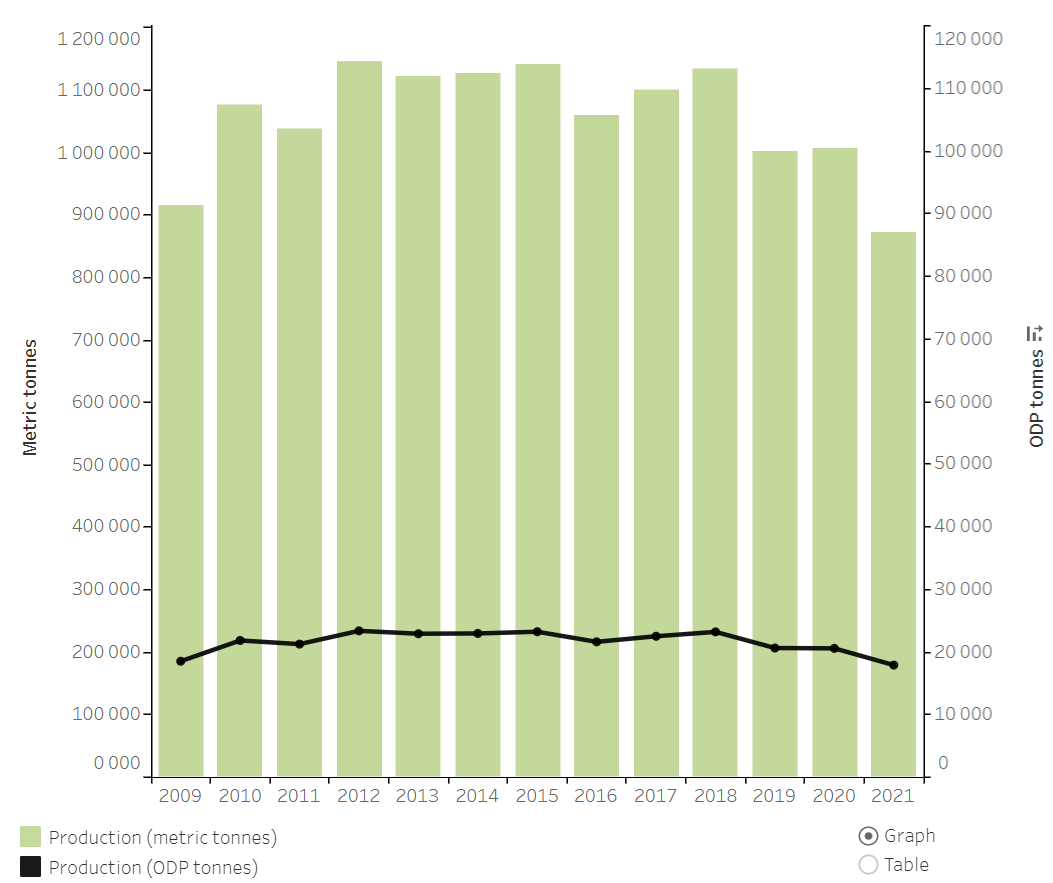
Virgin substances
These are substances that have been produced and have not been previously used. Newly produced substances are, by definition, virgin.
Non-virgin substances
These are substances that have been previously used and subsequently recovered from products and equipment, and/or been recycled or reclaimed.
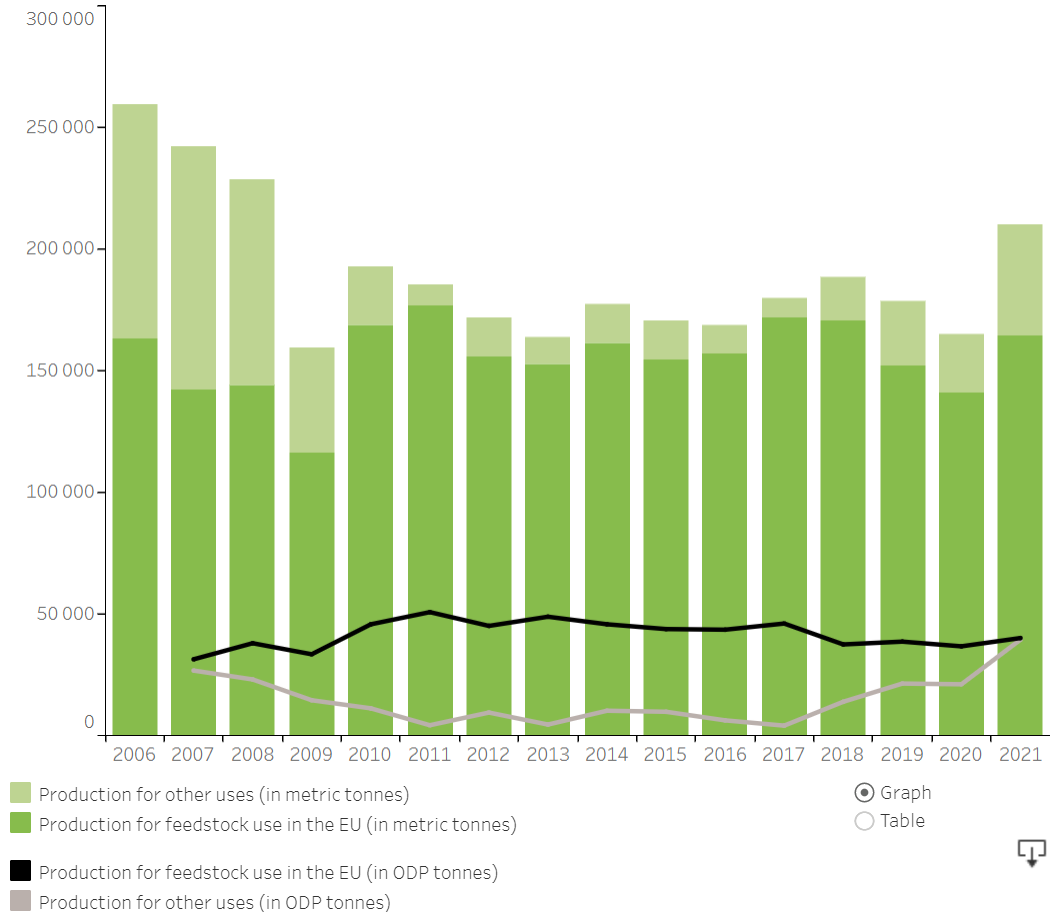
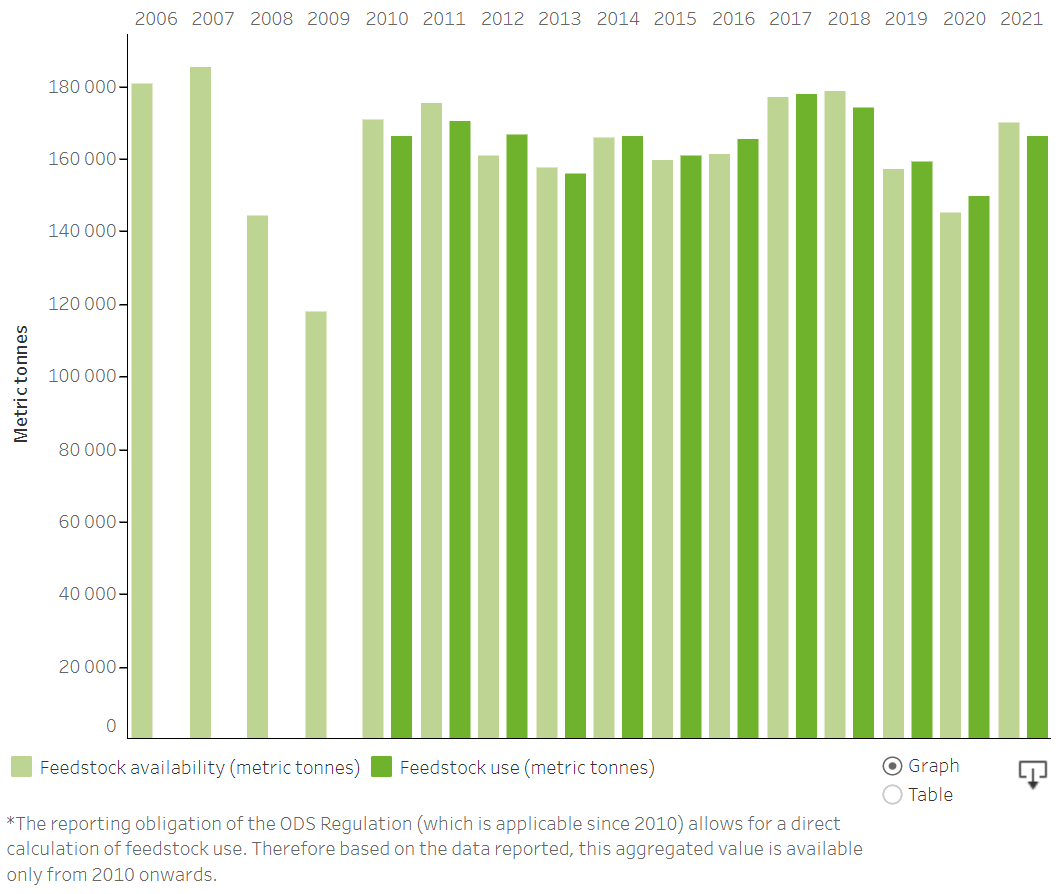
Feedstock
A number of ODS serve as chemical building blocks for the manufacture of other chemicals (i.e. as ‘feedstock’). They are used (directly or indirectly) for the manufacture of a diverse range of products including refrigerants, foam blowing agents, solvents, polymers, pharmaceuticals and agricultural chemicals.
Process agent
A process agent is a substance that either facilitates a chemical reaction or inhibits an intended chemical reaction in an industrial process.
Make-up
Make-up is the quantity of virgin, recovered or reclaimed controlled substances that has not been used in the process cycle before, and that is fed into the process cycle for the first time. For feedstock and process agent uses of controlled substances, make-up has to be reported, including the emissions generated during their use.
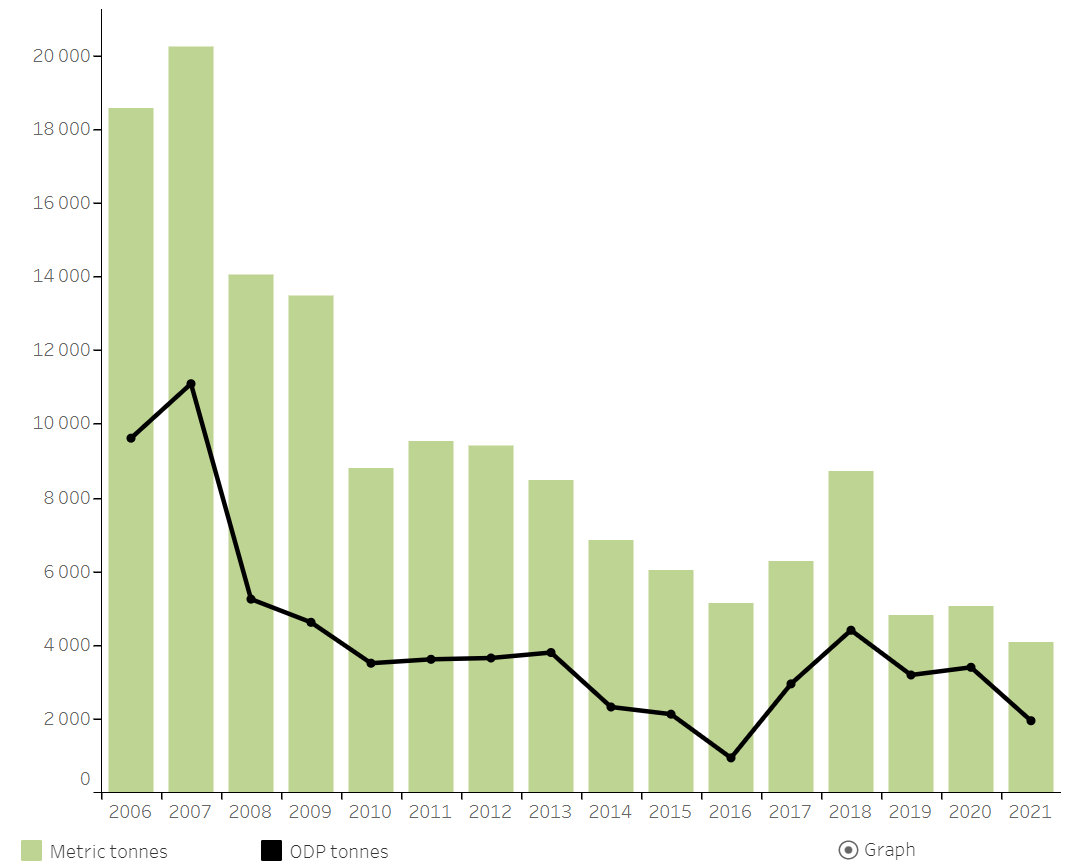
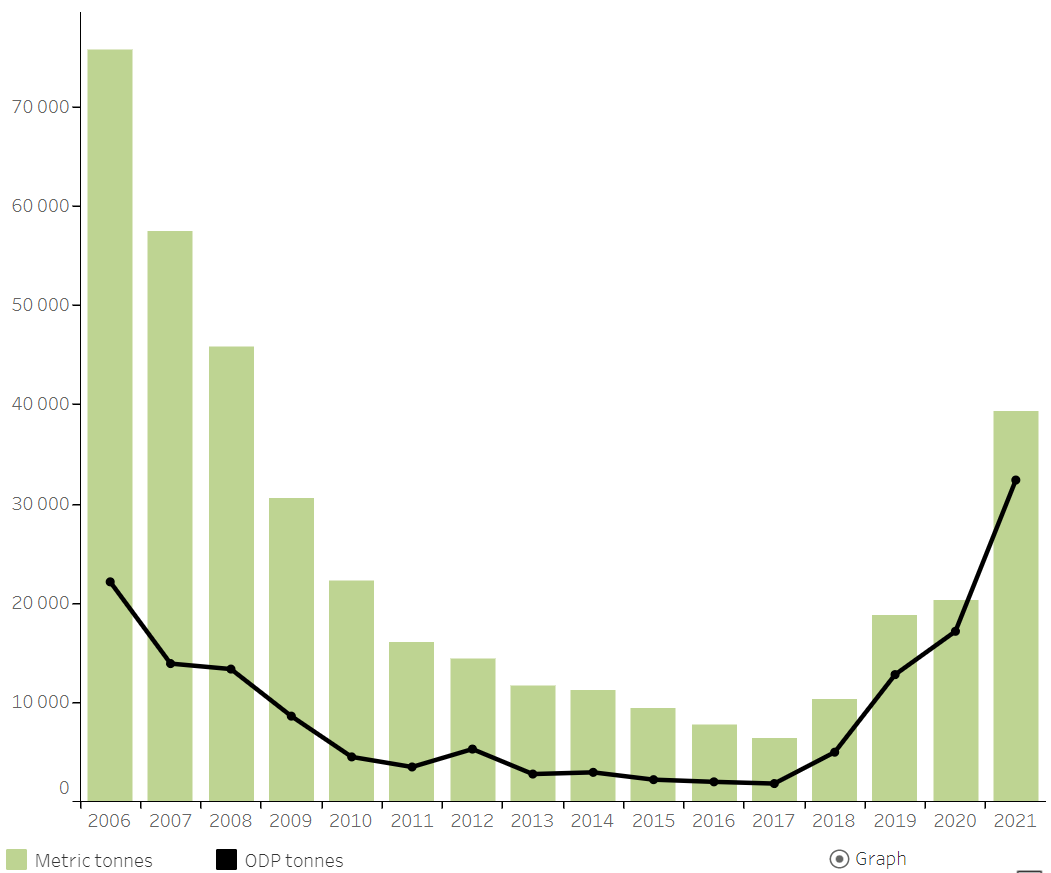
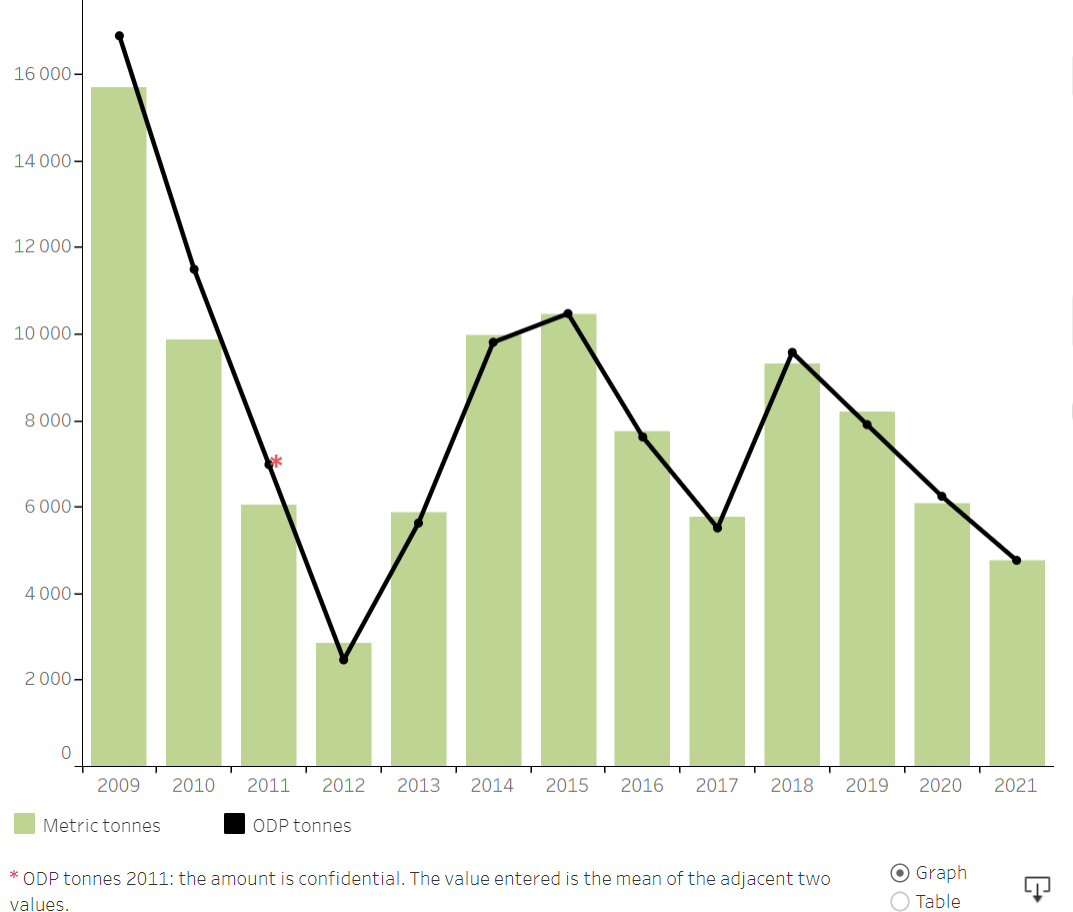
Ozone-depleting potential
The ozone-depleting potential (ODP) of a substance refers to the relative amount of ozone depletion caused by it. It is the ratio of the impact on ozone of the emission of a chemical substance to the impact of a similar emission by mass of CFC-11. The quantity in metric tonnes of a particular controlled substance is multiplied by its ODP to give its overall potential to deplete the ozone layer. For instance, 1 metric tonne of CFC-11 corresponds to 1 ODP tonnes (as its ODP is equal to 1), whilst for bromotrifluoromethane or halon 1301 (with an ODP = 10), 1 metric tonne corresponds to 10 ODP tonnes. The ODPs of controlled and new substances are listed in Annexes I and II of the Ozone Regulation. Some new substances have a range, rather than a single ODP value. In this online data viewer, the highest value of the ODP value range is used.

Document Actions
Share with others