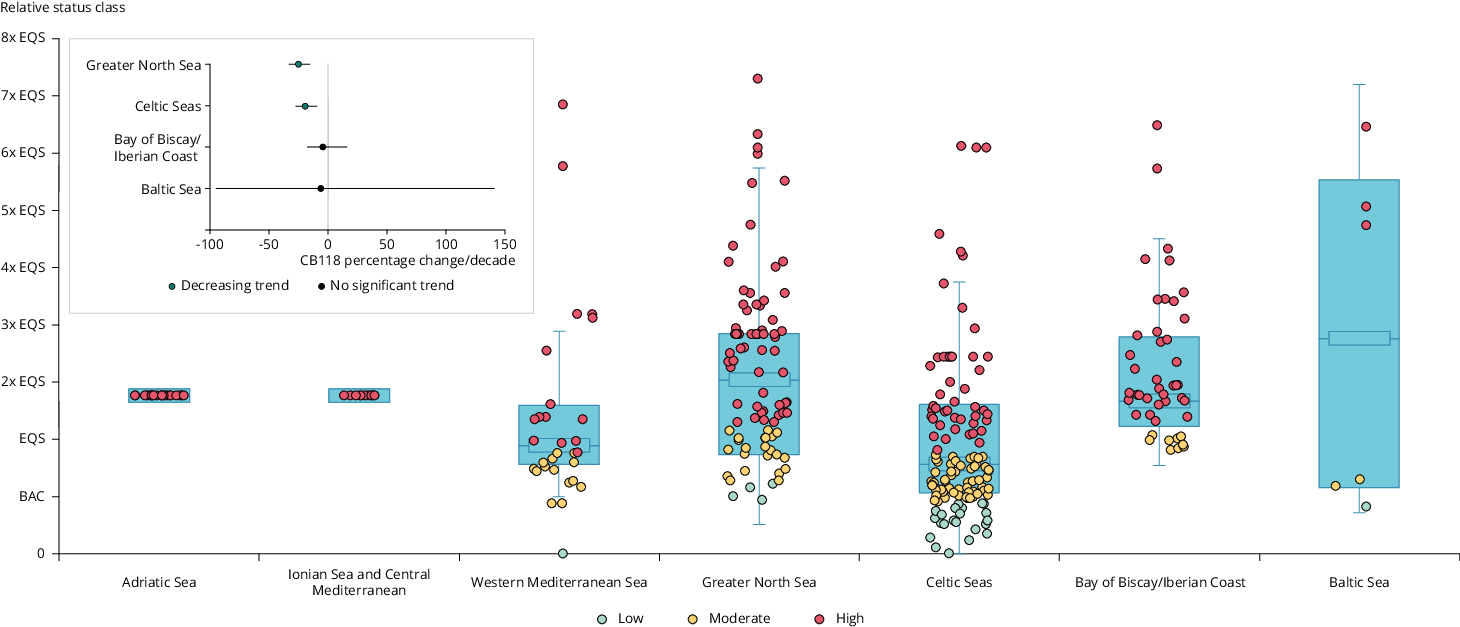
Concentrations of CB-118 in mussels and oysters are relative to environmental thresholds (3). Each point represents a location (station). The green points under the yellow line are locations with concentrations under BAC; the yellow points are over BAC but under EQS (Environmental Quality Standard), while the red points are locations with concentrations over EQS. The inset (upper left) shows time trends (change per decade) by the MSFD region over the most recently available 10-year period (meta-analysis of trends for each location). Significant decreases are shown in green, while insignificant time trends are shown in black. Regions not included in the time trend graph did not have enough data to enable trend analysis.
Geographical coverage
- Belgium, France, Germany, Ireland, Italy, Norway, Poland, Spain, Sweden, Netherlands, United Kingdom.
- Adriatic Sea, Ionian Sea and Central Mediterranean Sea, Western Mediterranean Sea, Greater North Sea, Celtic Seas, Bay of Biscay/Iberian Coast, Baltic Sea.


Document Actions
Share with others