All official European Union website addresses are in the europa.eu domain.
See all EU institutions and bodiesAn official website of the European Union | How do you know?
Environmental information systems
EN
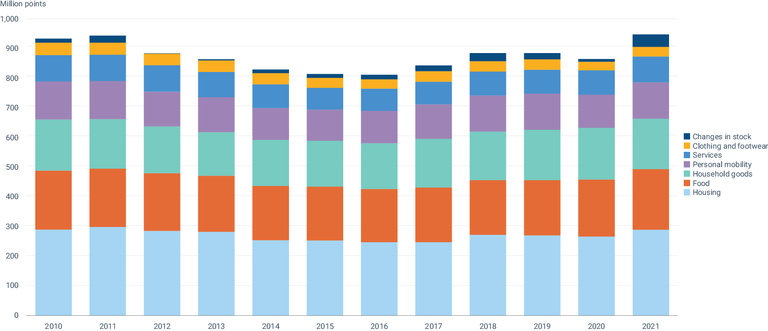
The graph shows the aggregated environmental impacts associated with each of the seven consumption domains, that are caused by EU consumption, regardless of where these impacts occur.
Loading