next
previous
items

Figure

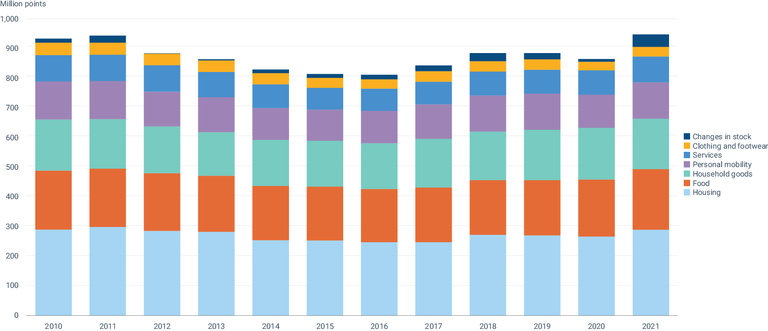
Weighted impacts of EU consumption in a single score (million points), divided into consumption domains from 2010 to 2021

Figure Created 20 Dec 2023 Published 18 Jan 2024 Last modified 18 Jan 2024
1 min read
The graph shows the aggregated environmental impacts associated with each of the seven consumption domains, that are caused by EU consumption, regardless of where these impacts occur.

European data

Metadata

Additional information

The data used is modelling results from a model hosted by the EEA

Permalinks

Geographic coverage

Temporal coverage

Document Actions