All official European Union website addresses are in the europa.eu domain.
See all EU institutions and bodies
An official website of the European Union | How do you know?
Environmental information systems
EN

- БългарскиBG
- češtinaCS
- HrvatskiHR
- danskDA
- NederlandsNL
- ελληνικάEL
- EnglishEN
- eestiET
- SuomiFI
- FrançaisFR
- DeutschDE
- magyarHU
- ÍslenskaIS
- italianoIT
- LatviešuLV
- lietuviųLT
- MaltiMT
- NorskNO
- polskiPL
- PortuguêsPT
- RomânăRO
- slovenčinaSK
- SlovenščinaSL
- EspañolES
- SvenskaSV
- TürkçeTR
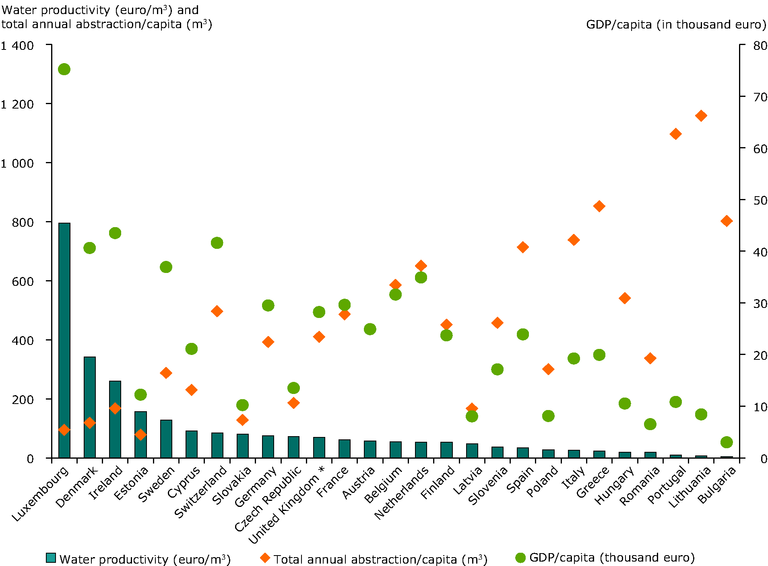
Water productivity, economic output per capita, and water use per capita
Chart (static)
-
Downloads
Data sources
Metadata
More info
Loading
- Greece
- Poland
- Romania
- Portugal
- Spain
- United Kingdom
- Netherlands
- Belgium
- Germany
- France
- Czechia
- Italy
- Cyprus
- Estonia
- Latvia
- Lithuania
- Finland
- Hungary
- Bulgaria
- Malta
- Denmark
- Sweden
- Austria
- Luxembourg
- Ireland
- Slovakia
- Slovenia
1998-2007
The above data have been obtained for the latest available years as follows: 1998 for Italy and Portugal; 1999 for Austria and Finland; 2001 for the United Kingdom; 2005 for Bulgaria; 2007 for Belgium, France, Germany, Greece, Ireland, the Netherlands, Slovakia, Sweden and Switzerland; 2008 for Estonia, Hungary, Romania and Spain; 2009 for Cyprus, Czech Republic, Denmark, Luxembourg, Poland and Slovenia; 2010 for Latvia and Lithuania.