All official European Union website addresses are in the europa.eu domain.
See all EU institutions and bodiesAn official website of the European Union | How do you know?
Environmental information systems
EN
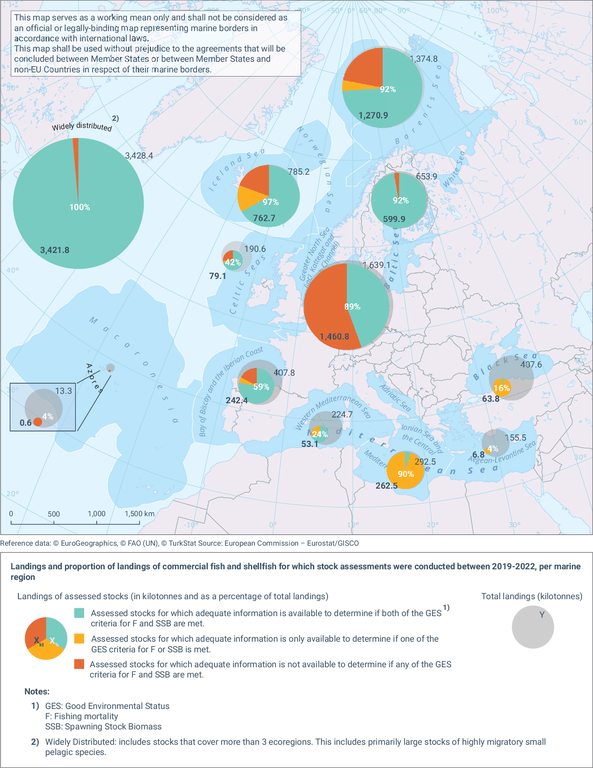
The figure shows the proportion of commercial European fish landings assessed per regional sea distinguishing between assessed and non-assessed stocks. For the assessed stocks a distinction is made between (i) landings of stocks for which information is available to determine Good Environmental Status (GES) for Fishing mortality (F) and/or Spawning Stock Biomass (SSB) and (ii) landings for stocks for which information is not available to determine GES for F and/or SSB.
Loading