All official European Union website addresses are in the europa.eu domain.
See all EU institutions and bodies
An official website of the European Union | How do you know?
Environmental information systems
EN

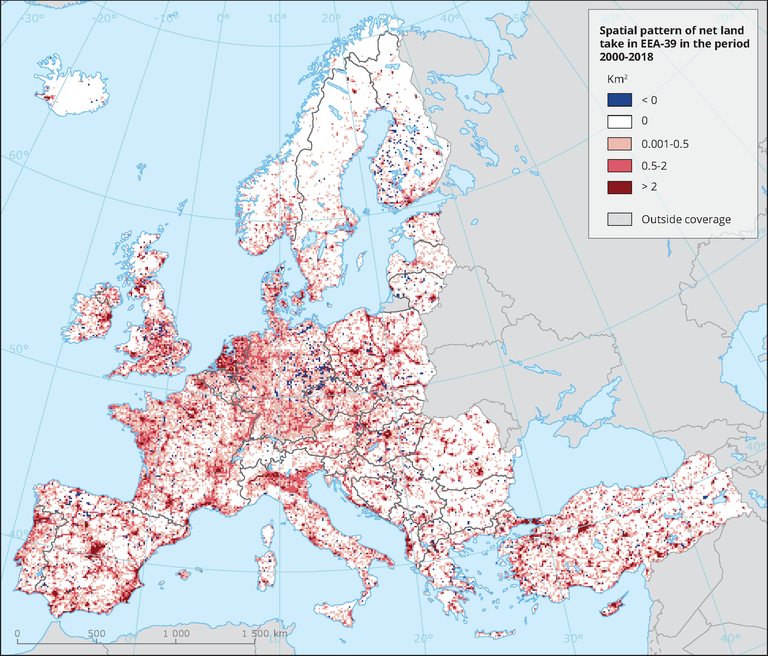
Net land take as a result of urban sprawl is measured from the Copernicus Corine Land Cover dataset between 2000-2018. The map shows for each grid cell the area in km² which was covered with sealed surfaces. For visualisation land take data is presented in a 10km grid.
Loading