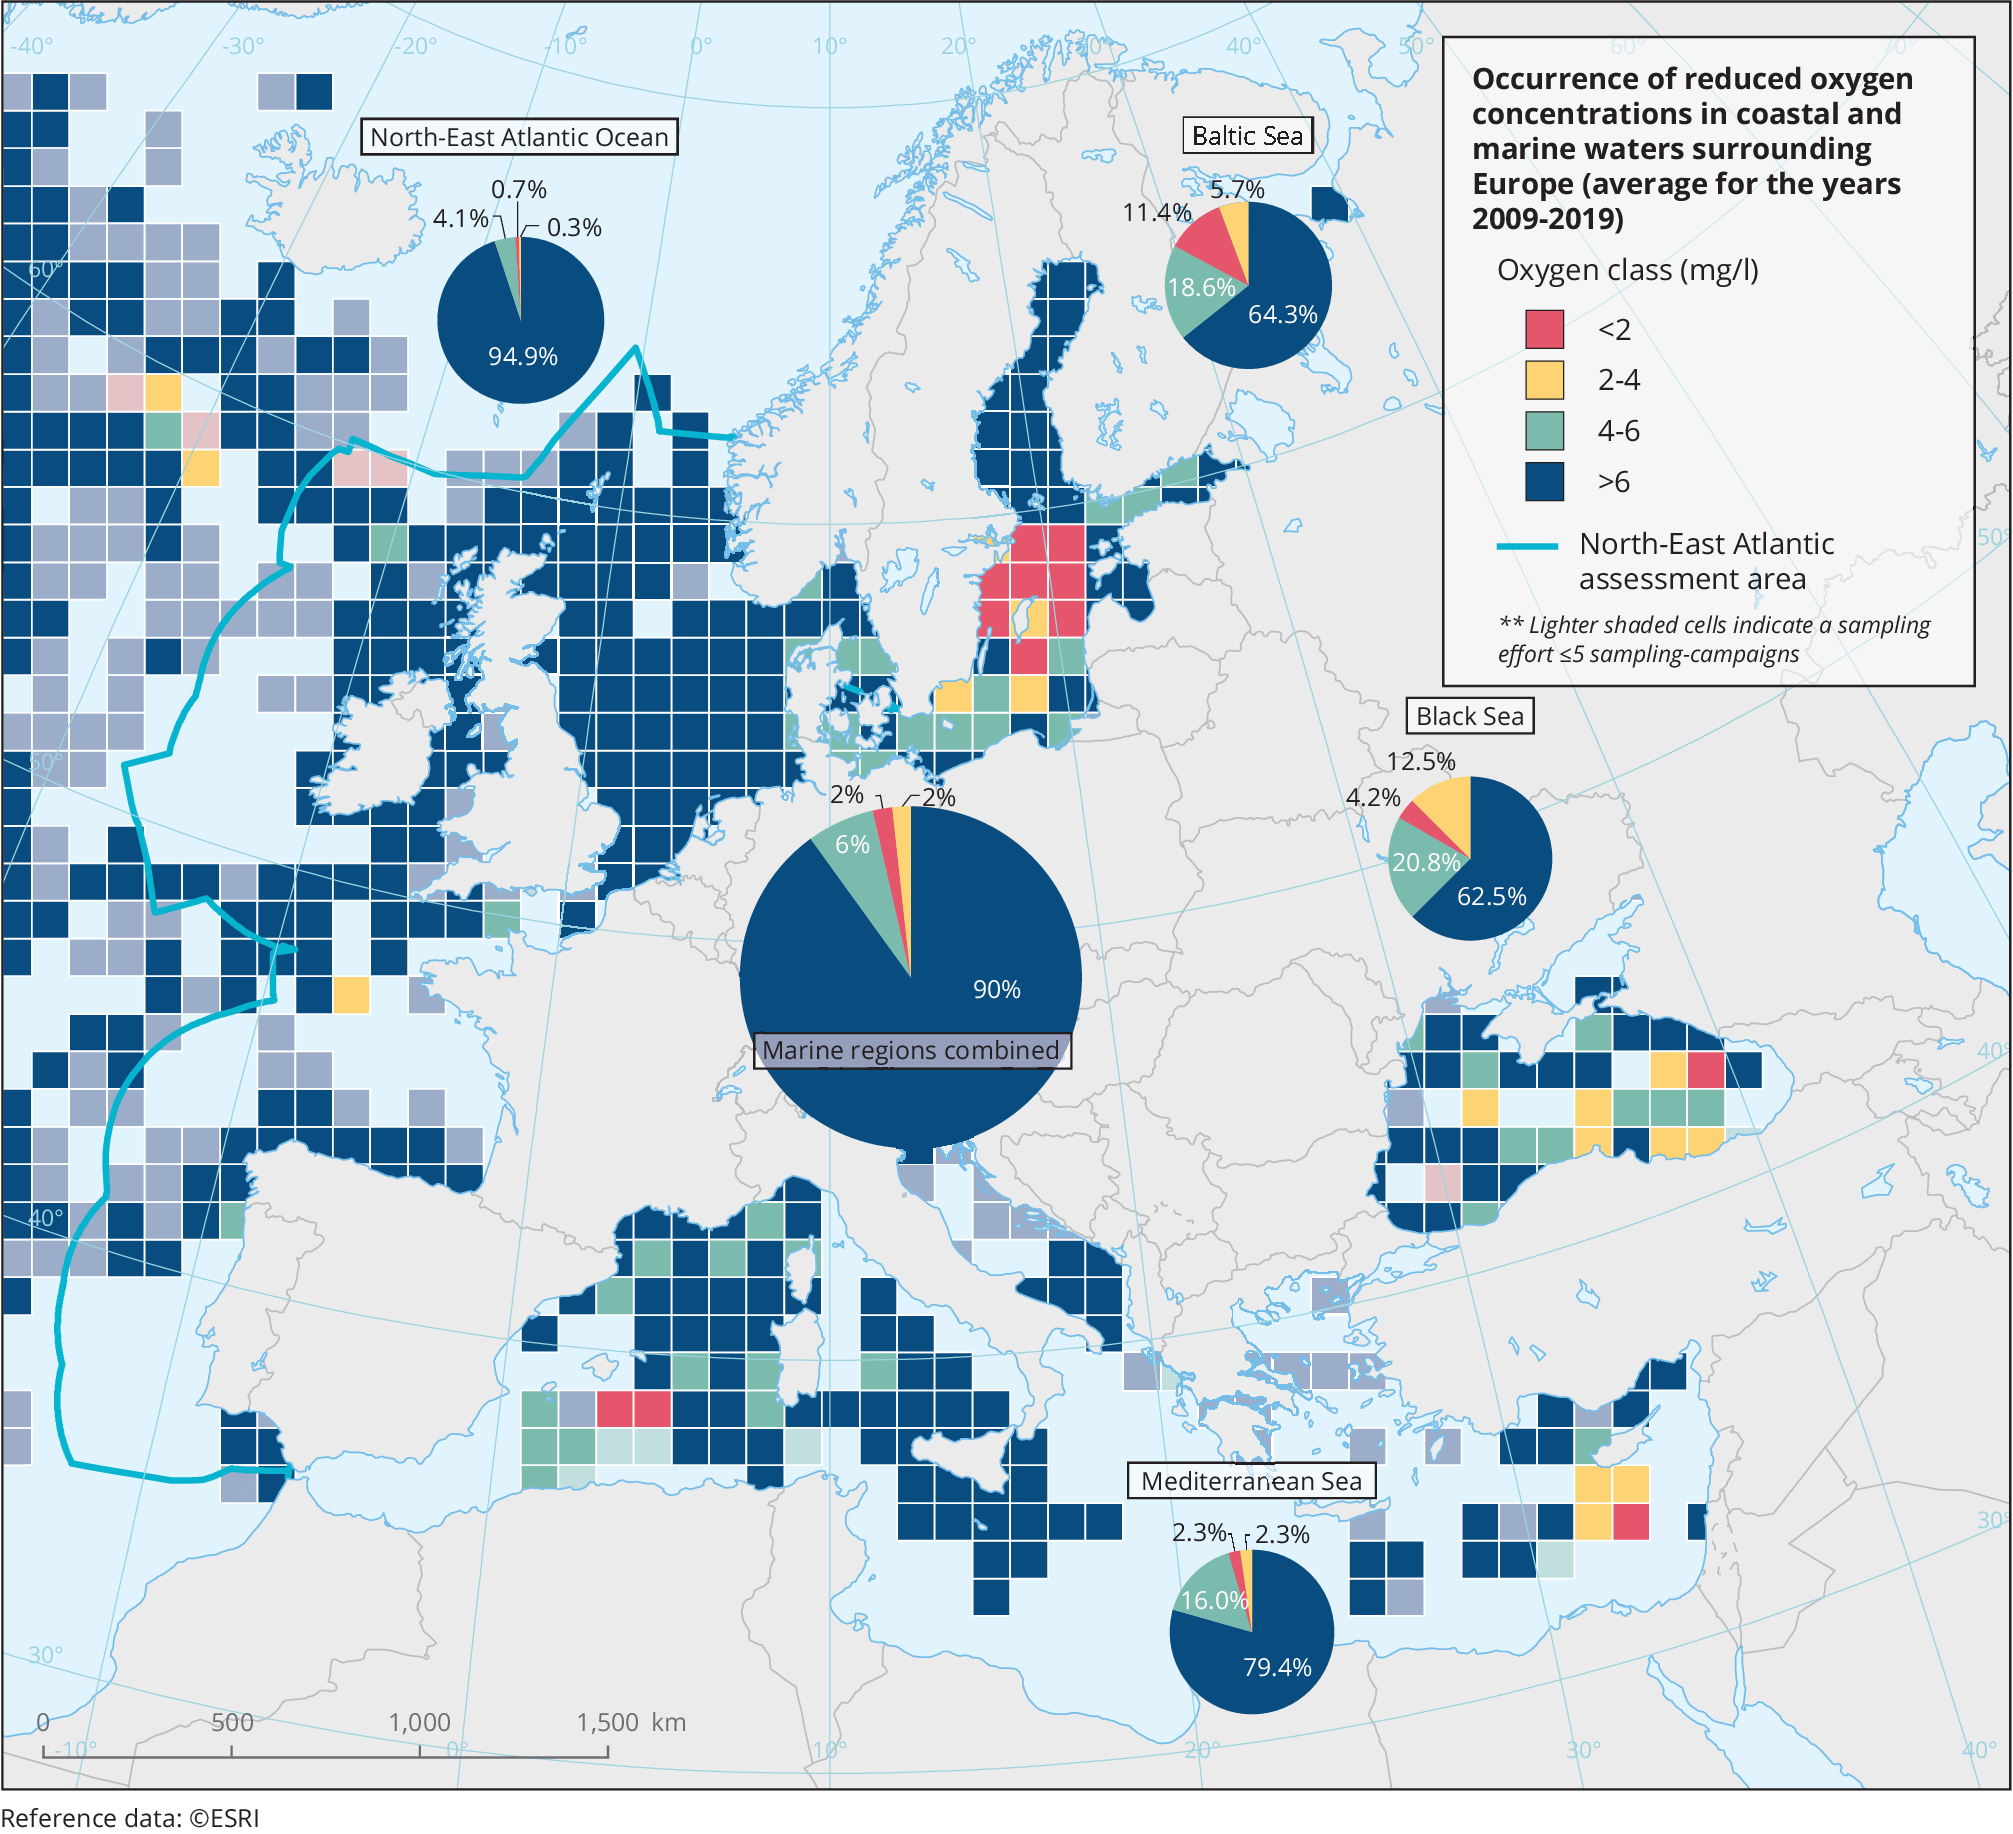
• The map shows the mean 25-percentile of dissolved oxygen (DO) concentrations in near-bottom waters during summer-autumn months over the period 2009-2019, by grid cell (EEA 100*100km grid).
• Results are shown by four classes of DO concentrations: three classes of reduced oxygen concentrations (<2mg/l; 2-4mg/l and 4-6mg/l) and oxygen concentrations > 6mg/l. Oxygen concentrations above 6mg/l are considered to support marine life with minimal problems while concentrations less than 2mg/l (hypoxia, oxygen deficiency) are considered to cause severe problems.
• Results reflect data availability, which may vary considerably across regions and over time. Lighter shaded cells indicate a sampling effort ≤5 sampling-campaigns. Blank cells indicate insufficient or no data availability.
Geographical coverage
Marine Strategy Framework Directive (MSFD) Marine regions: North-East Atlantic Ocean, Baltic Sea, Mediterranean Sea and Black Sea,

 taken in account for the measurement values(s) of the data resource.")
Document Actions
Share with others