All official European Union website addresses are in the europa.eu domain.
See all EU institutions and bodies
An official website of the European Union | How do you know?
Environmental information systems
EN

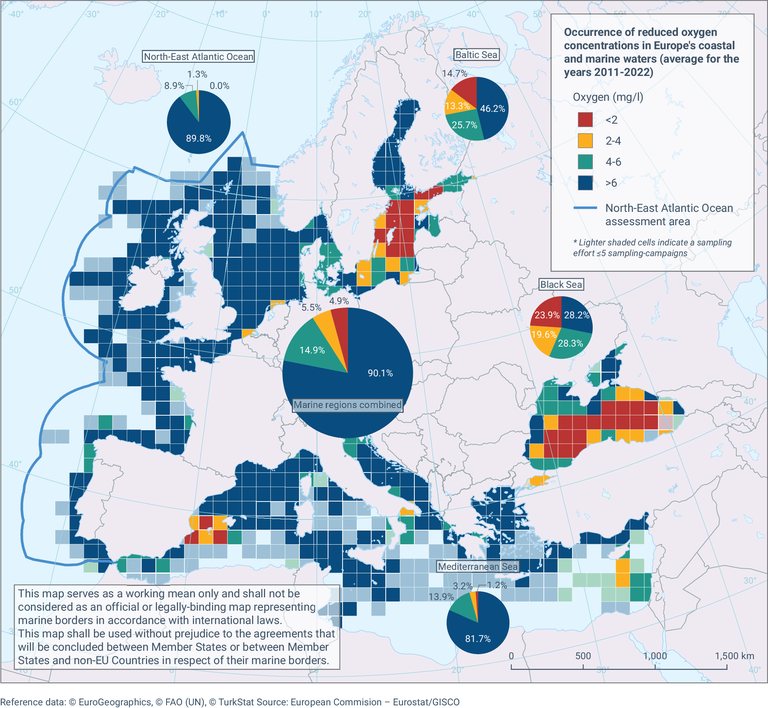
Observations are aggregated at the level of 100*100 km grid cells, and show the mean 25-percentile of dissolved oxygen (DO) concentrations subdivided in four classes (<2 mg/l, 2-4 mg/l, 4-6 mg/l, >6 mg/l). The pie charts indicate the relative spatial coverage of areas with the four different concentrations of DO, aggregated by Marine Strategy Framework Directive (MSFD) marine regions - North-East Atlantic Ocean, Baltic Sea, Mediterranean Sea and Black Sea (smaller pie charts) and for all regions combined (large pie chart in centre). Oxygen concentrations above 6mg/l are considered to support marine life with minimal problems while concentrations less than 2mg/l (hypoxia, oxygen deficiency) are considered to cause severe problems.
Loading