All official European Union website addresses are in the europa.eu domain.
See all EU institutions and bodies
An official website of the European Union | How do you know?
Environmental information systems
EN

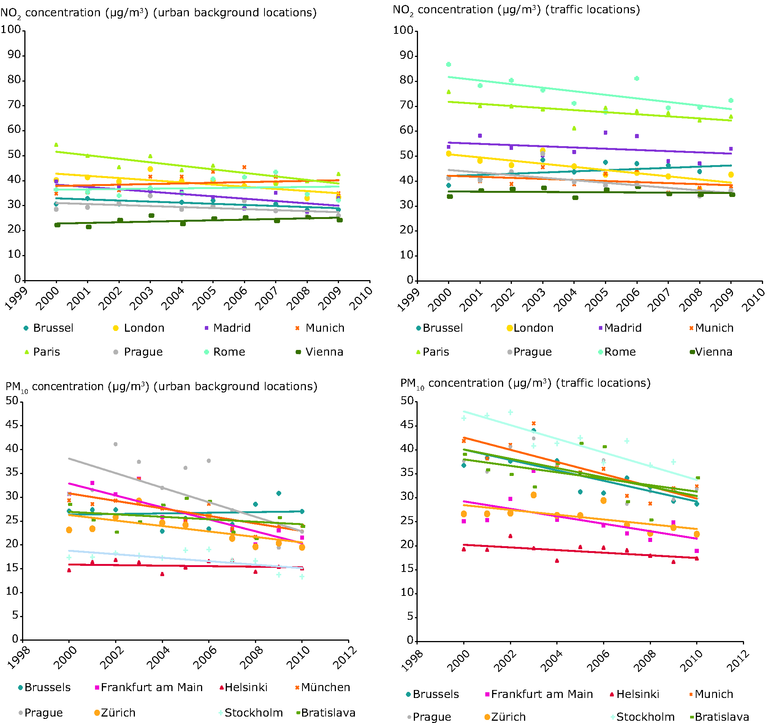
Trends of NO2 and PM10 atmospheric concentration at urban background and traffic locations. Comparison in several European urban area
Loading