All official European Union website addresses are in the europa.eu domain.
See all EU institutions and bodies
- БългарскиBG
- češtinaCS
- HrvatskiHR
- danskDA
- NederlandsNL
- ελληνικάEL
- EnglishEN
- eestiET
- SuomiFI
- FrançaisFR
- DeutschDE
- magyarHU
- ÍslenskaIS
- italianoIT
- LatviešuLV
- lietuviųLT
- MaltiMT
- NorskNO
- polskiPL
- PortuguêsPT
- RomânăRO
- slovenčinaSK
- SlovenščinaSL
- EspañolES
- SvenskaSV
- TürkçeTR
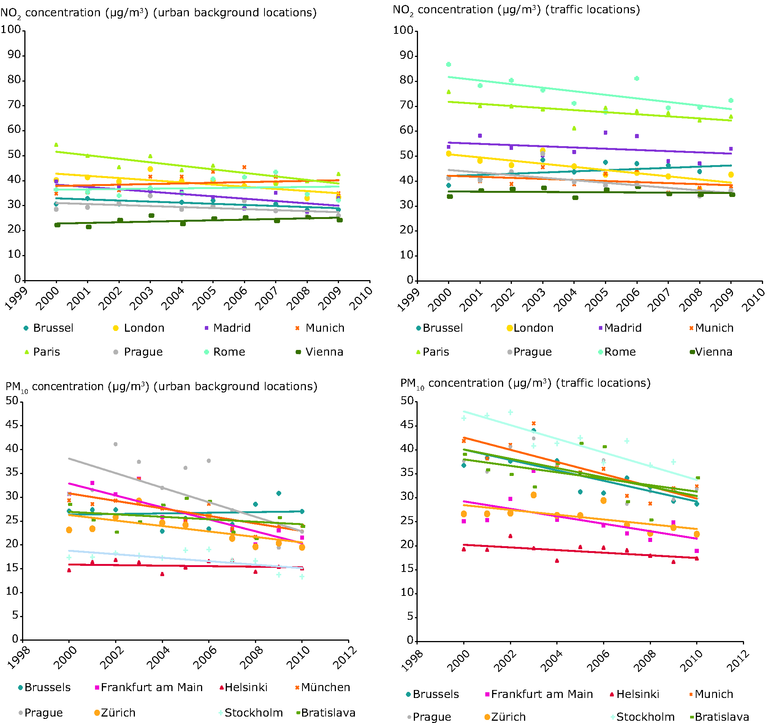
Trends in NO2 and PM10 concentrations at urban background and traffic locations
Chart (static)
Trends of NO2 and PM10 atmospheric concentration at urban background and traffic locations. Comparison in several European urban area

- Athens
- Austria
- Bratislava
- Czechia
- France
- Greece
- Iceland
- Krakow
- London
- Île-de-France
- Poland
- Prague
- Slovakia
- Stockholm
- Sweden
- United Kingdom
- Vienna
Units
Top: NO2 concentration µg/m3 in selected cities in 2000-2010. Bottom: PM10 concentrations µg/m3 in selected cities in 2000-2010.
Additional information
Top: NO2 concentration in selected cities from 2000 to 2010 at urban backgound and traffic locations.
Bottom: PM10 concentrations in selected cities from 2000 to 2010 at urban backgound and traffic locations.
Values are presented for single monitoring stations that provide reliable time series data for the period 2000 to 2010. Selected cities have at least one background and one traffic station that provide such reliability and can therefore be compared for analysis. Therefore, this figure does not represent air quality results citywide, but rather serves as a snapshot of the different trends in background and traffic stations wherever comparable long-term time-series data are available. Because the different lines represent individual measurement points, there can be a significant effect from local changes in traffic flows.
