next
previous
items

Figure

Average concentrations and trends of surface chlorophyll-a in transitional, coastal and marine waters surrounding Europe

Figure Created 24 Jan 2024 Last modified 21 Mar 2024
2 min read
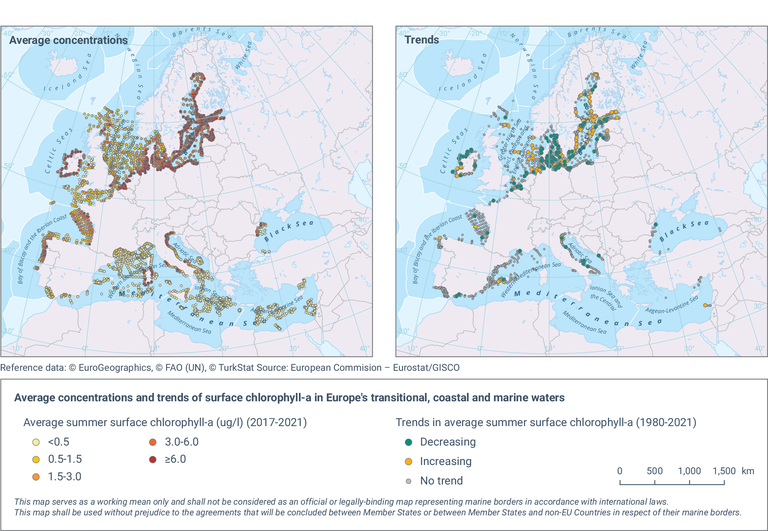
Average summer surface chlorophyll-a concentration (left) and trends (right), in locations recently updated (last update>2016) with at least 5 years of observations, in the period between 1980 and 2021. Green circles indicate stations with significant (p<0.05) decreasing trends (i.e., improving); orange circles show stations with significant (p<0.05) increasing trends (i.e., deteriorating); and grey circles show stations with no significant trends. Colour keys of symbols and values are included in the legend.

European data

Metadata

Additional information

• Average concentrations of chlorophyll-a (µg/l) and trends were calculated using data from observations in summer from the upper 10m of the water column, in locations with annual data for the last 5-year period (2016-2021).
• Growing season months considered are June-September for stations in the Baltic Sea north of 59 N and May–September for all other stations.
• Data were aggregated into squares with sides of 1.375km for coastal stations within 20km from the coastline and 5.5km for open water stations (more than 20km away from the coastline). A masking of 5km inwards from the coast was also applied.
• Temporal trends were estimated in locations with data for at least 5 years in the period 1980-2021 and updated in the last 5-year period (2017-2021), using the non-parametric Mann-Kendall test. A p-value <0.05 was considered to indicate a statistically significant trend.
• Results reflect data availability, which vary significantly across regions and over time.

Temporal coverage
1980-2021 (the temporal range specified is the maximum range of dates for raw observations but this range varies upon the availability of observations at each location).

Permalinks

Geographic coverage

Temporal coverage

Document Actions