Every year countries report air quality measurement data for a set of pollutants at a representative selection of stations. Reporting follows the requirements of the Council Decision 97/101/EC, a reciprocal Exchange of Information (EoI) on ambient air quality.
Airbase contains a large amount of data including calculated statistics on Europe’s air quality over the last decade. You can browse it in different ways:
Interactive maps
- Map air quality statistics at reporting stations. Every year countries report air quality measurement data for a set of pollutants at a representative selection of stations.
You can examine the annual air quality statistics by using our collection of interactive maps.
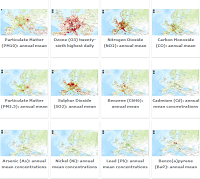
- See interpolated maps showing air quality in Europe. The maps are derived from the measurement data at the stations in AirBase in combination with modelled output from EMEP and with other parameters. These maps are assessment tools for use at the European scale. They may show results which differ from assessments made at national scale.

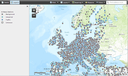
- See where reporting stations are located, what their characteristics are and what they measured. Zoom in by clicking on the map or by writing the name of a place - to see the AirBase station locations in details. Click on a station to display its data.
Data access

Document Actions
Share with others