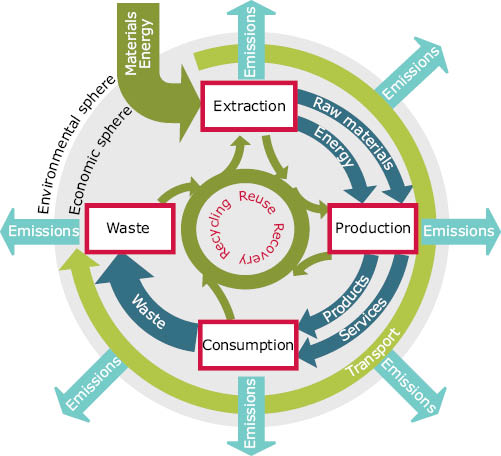
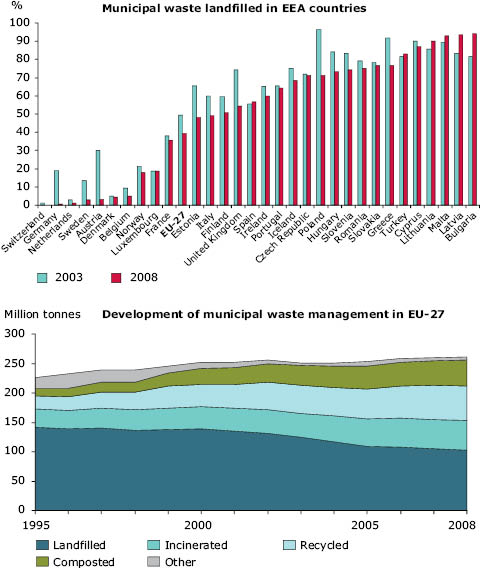
European waste management builds on the principles of a waste hierarchy: preventing waste; reusing products; recycling; recovering, including energy through incineration; and finally disposal. Waste is therefore increasingly also seen as a production resource and a source of energy. However, depending on regional and local conditions, these different waste management activities may have differing environmental impacts.
Although the impacts of waste treatment on the environment have been considerably reduced, there is still potential for further improvement, first by full implementation of existing regulations, and then through the extension of existing waste policies to encourage sustainable consumption and production practices including more efficient resource use.
Waste policies can primarily reduce three types of environmental pressures: emissions from waste treatment installations such as methane from landfills; impacts from primary raw materials extraction; and air pollution and greenhouse gas emissions from energy use in production processes. Although recycling processes themselves also have environmental impacts, in most cases the overall impacts avoided by recycling and recovery are greater than those incurred in the recycling processes (
17
).
Waste prevention can help reduce environmental impacts during all stages of the life-cycle of resources. Although prevention has the highest potential to reduce environmental pressures, policies to reduce waste generation have been sparse and often not very effective. For example, there has been an emphasis on diverting biowaste, including food waste (
D
) (
E
) (
18
) from landfills. But more might be achieved by addressing the whole food production and consumption chain to prevent waste, thus also contributing to sustainable resource use, protection of soil and mitigating climate change.
Waste recycling (and waste prevention) is closely linked to material use. On average, 16 tonnes of materials are used annually per person in the EU, much of which is sooner or later turned into waste: of the 6tonnes of total waste generated annually per person, around 33% is from construction and demolition activities, about 25% from mining and quarrying, 13% from manufacturing and 8% from households. However, direct links between resource use and waste generation are difficult to quantify with current indicators due to methodological differences in accounting for them and a lack of long-term time-series data.
Figure 4.4 Resource use per person, by country, 2000 and 2007
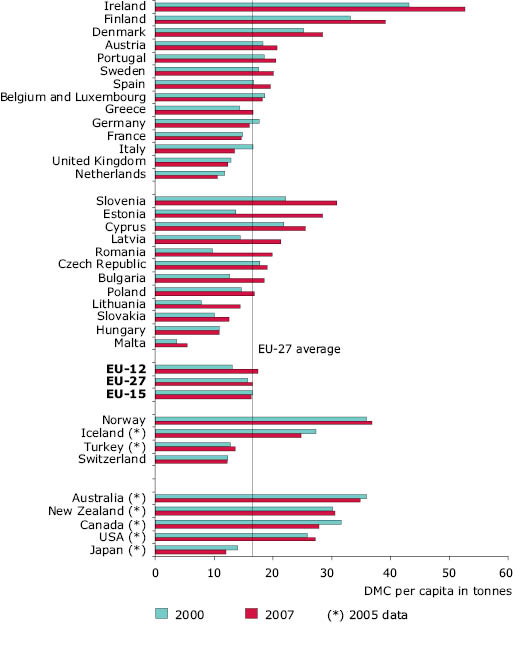
Note: Domestic material consumption (DMC) is an aggregate of materials (excluding water and air) which are actually consumed by a national economy. It includes used domestic extraction and physical imports (mass weight of imported goods) minus exports (mass weight of exported goods).
Source: Eurostat and OECD (DMC data); The Conference Board (
a
); Groningen Growth and Development Centre (population data). Link to data
The increases in overall resource use and waste generation in Europe are closely linked to economic growth and increasing affluence. In absolute terms, Europe is using more and more resources. For example, resource use increased by 34% between 2000 and 2007 in the EU-12. This continues to have considerable environmental and economic consequences. Of 8.2 billion tonnes of materials used in the EU-27 in 2007, minerals and including metals accounted for more than half, and fossil fuels and biomass for about a quarter each.
The resource use category which increased most between 1992 and 2005 was that of minerals for construction and industrial use. Differences between individual countries are significant: the use of resources per person varies by a factor of almost ten between the highest and the lowest numbers. Factors that determine resource use per person include climate, population density, infrastructure, availability of resources, level of economic development, and the structure of the economy.
Although the level of extraction of resources within Europe has remained stable, and in some cases has even decreased — some unmanaged burdens from past extraction persist related to mining closures. As Europe uses up reserves that are easy to access, it will have to rely more on less concentrated ores, less accessible resources and fossil fuels with lower energy content, which are expected to cause higher environmental impacts per unit of material or energy produced.
The high use of resources to fuel economic growth increases the problems of ensuring supplies and sustainable yields, and managing the environmental impacts in relation to ecosystems’ absorption capacities. A challenge for both policy and science is how best to measure environmental impacts that result from resource use; several current initiatives aim to better quantify the environmental impacts of resource use.
Box 4.1 Quantifying environmental pressures and the environmental impacts of resource use
Several initiatives aim to
better quantify the impacts of resource use and progress with decoupling
(for example, the decoupling of economic growth from resource use and
the decoupling of economic growth from environmental degradation).
Domestic material consumption
(DMC) is often used as a proxy for the environmental pressures of
resource use. DMC measures resources directly consumed within a national
economy, with an understanding that eventually each tonne of material
entering an economy will come out as waste or emissions. However, such a
mass-based approach does not address the large differences in
environmental impacts between different materials.
The environmentally-weighted
material consumption (EMC) indicator attempts to combine information on
material flows with information on environmental pressures for specific
categories including abiotic resource depletion, land use, global
warming, ozone layer depletion, human toxicity, terrestrial ecotoxicity,
aquatic ecotoxicity, photochemical smog formation, acidification,
eutrophication, and radiation. However, the EMC also focuses on
environmental pressures and thus only provides a proxy for related
impacts.
The national accounts matrix
extended by environmental accounts (NAMEA) approach aims to take the
assessment of environmental pressures further by also including
environmental pressures ‘embedded’ in traded goods and services. Thus
the results of the traditional materials accounting and NAMEA approach
may be quite different. This difference can be illustrated by looking at
greenhouse gas emissions: while traditional accounting for national
emissions is based on a territorial perspective, the NAMEA approach aims
to include all emissions induced by a nation’s consumption.
In addition to the above, a basket of indicators or
accounting approaches has been identified which aim to monitor
environmental impacts from resource use. These includes the ecological
footprint (EF) which compares human demand with planet Earth’s
ecological capacity to regenerate, human appropriation of net primary
production (HANPP), land and ecosystem accounts (LEAC) (
b
).
Source: EEA.
Reducing resource use in Europe also reduces environmental impacts globally
European economies are creating more and more wealth from the resources that we use. Resource efficiency in Europe has improved over the past two decades through the use of more eco-efficient technologies, the transition to service-based economies and an increased share of imports in EU economies.
However, differences in resource efficiency across Europe are substantial, with a factor of almost ten between the most and least resource-efficient EU economies. Factors that affect resource efficiency include the technological level of production and consumption; the share of services versus heavy industry; regulatory and tax systems; and the share of imports in total resource use.
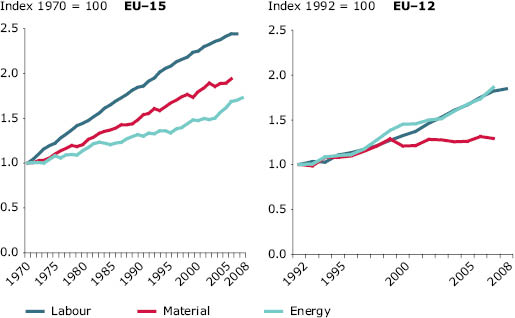
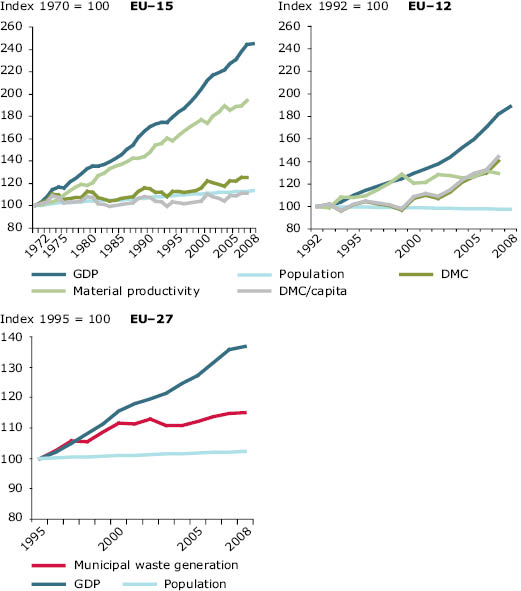
Figure 4.5 Growth in the productivity of labour, energy and materials, EU-15 and EU-12
Source: The Conference Board (a); Groningen Growth and Development Centre (GDP and working hours data); Eurostat; Wuppertal Institute for Climate, Environment and Energy (material data); International Energy Agency (energy data). Link to data
The magnitude of the differences between countries points to significant potential for improvement. For example, resource efficiency in EU-12 is only about 45% of that in the EU-15. The ratio has changed little over the past two decades, and efficiency improvements in the EU-12 were mostly recorded before 2000.
Indeed, the growth in the productivity of resources over the past forty years has been significantly slower than that in the productivity of labour and in some cases of energy. While some of this is a result of the restructuring of economies, with a growing share of services, it also reflects the fact that labour has become relatively more costly compared with energy and materials, partly as a result of prevailing tax regimes.
Addressing resource productivity and energy efficiency, substituting non-renewable with renewable resources, and addressing resource efficiency gaps between EU-15 and EU-12 Member States can provide opportunities for increasing European competitiveness.
Water demand management is essential for using water resources within natural limits
Water resource management differs from the management of other resources due to the unique characteristics of water as a resource: water moves through the hydrological cycle, is dependent on climatic influences, and its availability varies in time and space. It also connects different regions and other environmental media. Water is the basis for many ecosystem services — such as transport, energy provision, cleaning — but can also transfer impacts from one environmental medium or one region to another. This poses explicit needs for integration and cross-border cooperation.
Human demand for water is in direct competition with the water needed for maintaining ecological functions. In many locations in Europe, water used by agriculture, industry, public water supply and tourism put considerable stress on Europe’s water resources, and demand often exceeds local availability — and this is likely to be further exacerbated by climate change impacts.
Figure 4.6 Water exploitation index (WEI) — in late 1980s/early 1990s (WEI-90) compared to latest years available (1998 to 2007) (
F
)
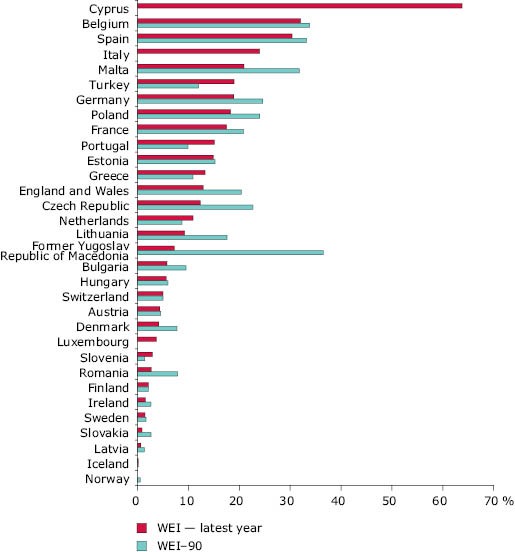
Note: WEI: annual total water abstraction as a percentage of available long-term freshwater resources.
The warning threshold, which distinguishes a non-stressed from a water scarce region, is around 20%, with severe scarcity occurring where the WEI exceeds 40%.
Source: EEA, ETC Water.
Water resources and the demand for water by different economic sectors are unevenly distributed across Europe. Even if water is abundant on a national scale, it may be scarce in individual river basins during different time periods or seasons. In particular river basins in the Mediterranean region, but occasionally also some northern regions, experience over-abstraction.
The main reasons for over-abstraction include increasing demand for irrigation and tourism. In addition, considerable ‘loss’ of water can occur in public distribution and supply networks prior to it reaching consumers, thus aggravating shortages in already water scarce regions. In some countries this loss in the supply network may be up to 40% of the total water supply in others it is below 10% (
19
).
A combination of economic and natural factors results in major regional differences in water use. Water use is stable in southern Europe and, decreasing in western Europe. This decrease is attributed mostly to behavioural changes, technological improvements and the prevention of water losses in distribution systems, supported by water pricing. Eastern Europe has experienced substantial decreases in water use — the average annual water use in the period 1997 to 2005 was around 40% lower than in the early 1990s — mainly as a result of the introduction of water meters, higher water prices, and the closure of some water-intensive industries (
19
).
In the past, European water management has largely focused on increasing supply by drilling new wells, constructing dams and reservoirs, investing in desalination and large-scale water-transfer infrastructures. Increasing problems of water scarcity and drought clearly indicate the need for a more sustainable management approach. There is a particular need to invest in demand management that increases the efficiency of water use.
Greater water efficiency is possible. For example, there are large but currently unrealised potentials for water metering and the reuse of wastewater (
19
). Reuse of wastewater has been proved internationally, in water-stressed regions, to be a drought-proof source of water and one of the most effective solutions to water scarcity. In Europe, wastewater is reused mainly in southern Europe. Provided that the quality is thoroughly controlled, the benefits can be substantial, including increased availability of water, reduced nutrient discharges, and reduced manufacturing costs for industry.
Not least, land use practices and development planning could have a major impact on water scarcity, through parallel, compatible considerations of the use of groundwater and surface water. Intensive exploitation of aquifers can give rise to over-exploitation, such as that related to excessive abstraction for irrigation. The resulting short-term increase in productivity and change in land use impacts further exacerbates groundwater exploitation and can establish a cycle of unsustainable socio-economic developments — including risk of poverty, social distress, energy and food security (
20
).
Land-use practices can also cause significant hydro-morphological alterations with potential adverse ecological consequences. For example, many important wetlands, forests and floodplains in Europe have been drained and dammed, regulations and channels have been constructed to support urbanisation, agriculture, energy demand and protection from floods. The issues of water quantity and quality, irrigation water demand, water-use conflicts, environmental and socioeconomic aspects and risk management aspects can be better integrated in the institutional and political systems.
The Water Framework Directive (WFD) provides a framework to integrate high environmental standards for water quality and use into other policies (
6
). A first look at river basin management plans, which have been set up and reported by Member States during the first round of implementation of the WFD, indicates that a significant number of water bodies face a high risk of not achieving good ecological status by 2015. In many cases, this is due to issues related to water management, particularly linked to water quantity and irrigation, modifications of the structure of river-banks and river-beds, the connectivity of rivers or unsustainable flood protection measures which have not been addressed by earlier, pollution-oriented policies.
The overall challenge which the WFD can help tackle, if implemented fully, is to ensure the sustainable availability of good water quality, as well as managing inevitable trade-offs between competing uses, such as domestic use, industry, agriculture and the environment (see also Chapter 6).
Consumption patterns are key drivers of resource use and waste generation
The use of resources, water, energy and the generation of waste are all driven by our patterns of consumption and production.
The majority of greenhouse gas emissions, acidifying substances, tropospheric ozone precursor emissions and material input caused by the life-cycles of activities related to consumption can be allocated to the main consumption areas of eating and drinking, housing and infrastructures, and mobility. Within nine countries analysed (
F
), these three consumption areas contributed 68% of greenhouse gas emissions, 73% of acidifying emissions, 69% of tropospheric ozone precursor emissions and 64% of direct and indirect material input, including use of domestic and imported resources in 2005.
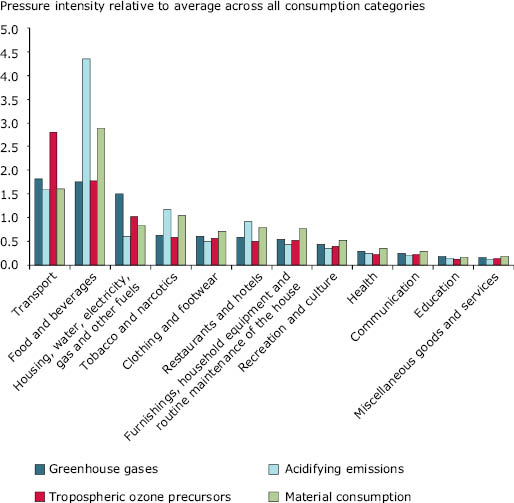
Eating and drinking, mobility, and to a lesser extent housing, are also the areas of household consumption with the highest pressure intensities, which indicates the largest environmental pressures per Euro spent. Reductions in environmental pressures caused by household consumption could be achieved by reducing the pressure intensities within individual consumption categories — for example, through improvements in housing energy efficiency; by switching transport expenditure from private cars to public transport; or by shifting household expenditure from a pressure-intensive category (such as transport) to a low intensity one (such as communication).
European policy has only recently begun to address the challenge of the growing use of resources and unsustainable consumption patterns. European policies, such as the Integrated Product Policy (
21
) and Directive on Eco-design (
22
) focused on reducing the environmental impacts of products, including their energy consumption, throughout their entire life-cycle: it is estimated that over 80% of all product-related environmental impacts are determined during the design phase of a product. In addition, EUpolicies also stimulate innovation-friendly markets with the EULead Markets initiative (
23
).
Figure 4.7 Pressure intensity (unit pressure per Euro spent) of household consumption categories, 2005
Source: EEA NAMEA project.
The 2008 EU Action Plan on Sustainable Consumption and Production and Sustainable Industrial Policies (
24
) reinforces life-cycle approaches. In addition, it strengthens green public procurement and initiates some actions to address consumer behaviour. However, current policies do not sufficiently address the underlying causes of unsustainable consumption, tend to focus instead on reducing impacts, and are often based on voluntary instruments.
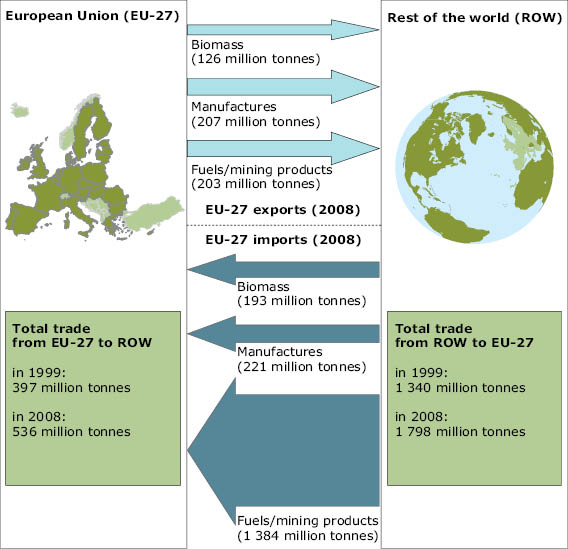
Figure 4.8 EU-27 physical trade balance with the rest of the world, 2008
Source: EEA, ETC Sustainable Consumption and Production (based on Eurostat).
Trade facilitates European resource imports and shifts some of the environmental impacts abroad
Overall, much of the EU resource base is now located abroad — more than 20% of resources used in Europe are imported (
25
) (
26
). This import reliance is particular apparent with regard to fuels and mining products. A side-effect of this trade balance is that some of the environmental impacts of European consumption are felt by the exporting countries and regions.
Europe is, for example, a net importer of fodder and cereals for European meat and dairy production. Also, more than half of EU fish supplies are imported: the 4 million tonne gap between fish demand and supply in Europe is being made up through aquaculture and imports (
27
). This increasingly raises concerns about the impacts on fish stocks, as well as other environmental impacts related to food production and consumption (Chapter3).
For many materials and trade goods, the environmental pressures related to their extraction and/or production — such as the waste generated, or water and energy used — affect the countries of origin. However, even though these pressures can be significant, they are not captured in indicators commonly used today. For some products, for example computers or mobile phones, those pressures may be several orders of magnitude higher than the actual weight of the product itself.
Another example for the use of natural resources embedded in traded products is the water required in growing regions for many food and fibre products. Their production results in an indirect and often implicit export of water resources: for example, 84% of the EUcotton-related water footprint, which is a measure for the total amount of water used to produce goods and services consumed — lies outside the EU, mostly in water-scarce region with intensive irrigation(
28
).
Trade-related environmental impacts may be further aggravated by lower social and environmental standards in some exportingcountries, especially compared to those in the EU. However, globalisation and trade also enable resource-rich countries to export resources and raise revenues. If managed properly, for example by offering dedicated incentives, the benefits can increase the environmental efficiency of both exports and imports by enhancing green export competitiveness and reducing embedded environmental pressures in imports.
Natural resource management is linked to other environmental and socio-economic issues
The direct environmental impacts of resource use include the degradation of fertile land, water shortages, waste generation, toxic pollution, and biodiversity loss in terrestrial and freshwater ecosystems. In addition, indirect environmental impacts, for example related to land-cover changes, may have considerable effects on ecosystem services and health.
Climate change is expected to increase environmental pressures related to resource use as changing precipitation patterns in the Mediterranean, for example, put additional pressure on water resources and influence land-cover changes.
Most environmental pressures assessed in this report are driven — directly or indirectly — by the increasing use of natural resources for production and consumption patterns that leave an environmental footprint in Europe and elsewhere in the world. Furthermore, the related depletion of our stocks of natural capital and its links to other forms of capital is putting at risk the sustainability of Europe’s economy and social cohesion.



Document Actions
Share with others