15. Environmental taxes
| indicator |
policy issue |
DPSIR |
assessment |
| environmental taxes compared with
total tax revenue |
any progress in the use of
environmental taxes? |
response |
 |
Since 1980, revenues from environmental
taxes have been increasing slowly. In 1997, they were slightly less
than 7 % of total taxation and contributions paid by employees and
employers to social security funds (social contributions). Taxes on
polluting activities and products in the EU are small and have not
increased significantly over the past 15 years. With the exception
of Denmark and the Netherlands, energy taxes produce more than half
of the revenue from environmental taxes in EU Member States. Energy
and transport taxes provide more than 90 % of the total revenue
from environmental taxes in most countries.
Environmental taxes are increasingly seen as
efficient and effective instruments of environmental policy. These
taxes take account of external environmental effects of economic
activities and thus create fairer prices (i.e. ‘getting the price
right’) for activities, products and services that consume natural
resources and/or pollute the environment. Increasing the prices of
such commodities through environmental taxes is generally expected
to reduce consumption and thus relieve some of the pressures on the
environment.
Ideally, progress in the use and impact of
environmental taxes should be measured against their environmental
effectiveness and economic efficiency. This requires advanced
analysis and, as yet, not many results are available. A planned EEA
report is expected to provide more information (EEA, in press).
The relative price increase of taxed products
and activities can be taken as a first indication of the potential
effect of taxes. For example, the real price of energy products
(Figure 3.5) has decreased (as explained in Chapter 3), although
revenue from energy taxes has increased (Figure 15.2). Chapter 5
gives information on fuel prices.
The indicators in this Chapter give an overview
of the trend in environmental tax revenue.
15.1. Tax revenues
New environmental taxes help to relieve some of
the burden of other direct taxes such as income tax and social
contributions in achieving a fixed amount of total tax revenue.
‘Ecological tax reform’ is generally assumed to have a positive
economic impact; it reduces the cost of labour and may increase
employment. The term ‘double dividend’ is used to describe this
alleged positive economic impact in combination with better pricing
of environmental effects.
Many EEA member countries apply environmental
taxes to a wide range of activities, products and services, e.g.
energy, transport, polluting substances, packaging, waste products
and chemicals. Surveys and studies carried out during the past
decade suggest that the use of taxes and charges is increasing
(OECD, 1989, 1994, 1999; European Commission/DG Environment, 1998;
EEA, in press).
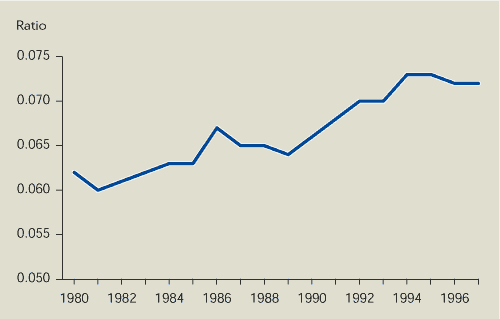
However, the ratio of revenue from
environmental taxes to revenue from other taxes and social
contributions in EU Member States is still small (Figure 15.1).
Environmental taxes are defined as energy taxes (including taxes on
transport fuels), transport taxes and ‘dedicated’ pollution taxes.
Between 1980 and 1997, this revenue ratio grew slowly from 6 % to
slightly over 7 %. Although revenue from other taxes and social
contributions also increased during this period, their growth was
smaller than the growth of environmental taxes. This change
indicates that the tax burden on economic activities is shifting
slightly towards products and activities with a negative
environmental impact and away from other tax bases such as labour.
Progress can be detected, but it is marginal. However, the revenue
data includes only fiscal taxes such as excise duty on petrol, and
excludes environmental charges such as water pollution charges
which can yield substantial revenues.
Figure 15.1:
Ratio of revenue from environmental taxes to revenue from other
taxes and social contributions, 1980-1996

Source:
Eurostat
Note:
Environmental taxes are defined as energy taxes (including taxes on
transport fuels), transport taxes and dedicated pollution
taxes.
 The ratio of revenue from environmental taxes to revenue
from other taxes and social contributions is small, but increasing
slowly.
The increase in the share of environmental
taxes in total tax revenue — in particular due to increasing energy
taxes — could point to a growing role for environmental taxes as
instruments of environmental policy. However, there are several
possible reasons for the increased revenue. Revenue will generally
increase when the number of taxes increases or if tax rates are
higher — both are positive for the environment. Evidence for these
developments is provided by OECD surveys (OECD, 1989, 1994, 1999).
Revenue will also increase if the magnitude of taxed polluting
activities increases or if more polluting products are sold — a
negative development for the environment; these trends are also
quite likely. During the period covered by Figure 15.1, there has
been a general growth in the economy and in the two economic
sectors — energy consumption and transport — which provide most
(about 90 %) of total environmental tax revenue.
The question then is whether environmental
taxes have an incentive impact. Despite the lack of information on
the environmental effectiveness of taxes and charges, there is some
evidence that environmental taxes do work (e.g. EEA, 1996, in
press; OECD, 1999). If this is true, it means that in the absence
of environmental taxation, polluting activities would have risen
more than they actually did (assuming other policy measures
affected the same actors equally).
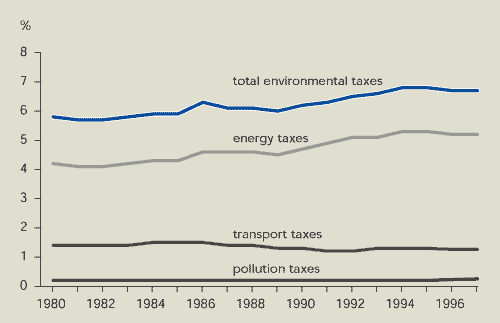
Figure 15.2:
Environmental taxes as a percentage of total taxes and social
contributions, 1980-1997

Source:
Eurostat
Note:
Energy taxes include taxes on transport fuels. The latter make up
more than three-quarters of energy taxes.
 The increase in revenue from environmental taxes is
caused by a growth in energy taxes. The revenue from ’dedicated’
pollution taxes is small and not increasing.
The slight increase in the share of
environmental taxes in total tax revenues and social contributions
is mainly due to the increase in energy taxes from about 4 % to 5 %
(see Figure 15.2). Transport taxes remained constant and
pollution taxes made only a marginal contribution.
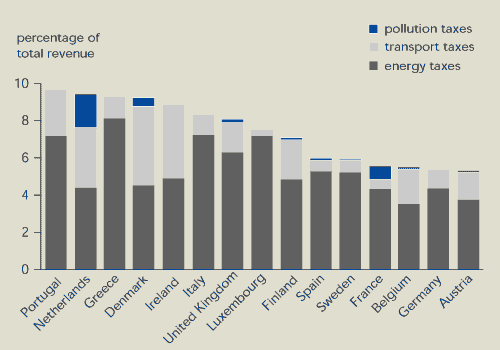
As shown in Figure 15.3, the contribution of
environmental taxes to total tax revenues and social contributions
varies widely between EU Member States: it ranges from 5 % in
Austria to 10 % in Portugal. Energy taxes dominate, with pollution
taxes significant only in Denmark, France and the Netherlands.
Transport taxes are as important as energy taxes in Denmark,
Ireland and the Netherlands, but much less important in France and
Italy (where tolls are charged on major motorways) and in Sweden.
Despite its lower tax levels, Luxembourg receives a large amount of
revenue from fuel taxes due to ‘fuel tourism’ from neighbouring
countries.
Figure 15.3:
Revenue from environmental taxes in EU Member States as a
percentage of total revenue from taxes and social contributions,
1997

Source:
Eurostat
 ‘Dedicated’ pollution taxes are significant only in Denmark,
France and the Netherlands.
| Ecological tax reform in the Netherlands |
|
The Dutch government is preparing the new Income Tax Act, due to
come into effect on 1 January 2001. One objective of the
new taxation system is to promote sustainable economic development
through greater emphasis on environmental levies.
Dutch consumers who buy energy-efficient appliances for their
households or take energy-saving measures in their homes will be
able to get a financial premium from energy companies and hence
reduce their energy bills. The premium will be paid only to
consumers who buy an appliance that meets the highest level of
energy efficiency in the EU labelling system. These premiums are
expected to be financed with revenue from increased energy
taxes.
|
15.2. Indicator improvement
A general evaluation of progress in
environmental taxation cannot easily be achieved using indicators.
Current data is insufficient for the advanced analysis required to
measure effectiveness and efficiency in quantitative terms.
However, some improvement in the indicators could be achieved in
the near future. A breakdown of tax revenues according to number of
taxes, tax rates and level of polluting activities and products
would be helpful. More information on the relative price increases
of taxed products and activities due to environmental taxes could
provide a better indicator of the effectiveness of these taxes than
their total revenues.
The indicators in this Chapter include only
fiscal taxes (i.e. payments into the public purse). For a complete
analysis, the significant environmental charges (i.e. payments for
environmental services) imposed by many Member States should be
included, but available data is incomplete and inconsistent.
15.3 References and further reading
European Commission (1996). Manual:
statistics on environmental taxes. European Commission,
Brussels.
European Commission (1997b). Communication
on environmental taxes in the single market. COM(97)9.
European Commission, Brussels.
European Commission/DG Environment (1998).
Database on environmental taxes in the European Union Member
States, plus Norway and Switzerland.
http://europa.eu.int/comm/dg11/enveco/database.htm.
EEA (1996). Environmental taxes:
implementation and environmental effectiveness. European
Environment Agency, Copenhagen.
EEA (in press). Environmental taxes and
charges: tools for integration and environmental policy.
European Environment Agency, Copenhagen.
OECD (1989). Economic instruments for
environmental protection. Organisation for Economic
Co-operation and Development, Paris.
OECD (1994). Managing the environment: the
role of economic instruments. Organisation for Economic
Co-operation and Development, Paris.
OECD (1999). Economic instruments for
pollution control and natural resources management in OECD
countries: a survey. Organisation for Economic Co-operation
and Development, Paris.
OECD (1999). Consumption tax trends.
Organisation for Economic Co-operation and Development, Paris.


Document Actions
Share with others