2. Integration of sectors and the environment
At its meeting in Cardiff in June 1998, the
European Council called for its respective Councils to develop
strategies to integrate the environment into their policies and to
develop indicator sets to support assessment of progress. Sectoral
indicators can be used to describe progress made in individual
sectors, but they also serve to compare sectors. The restricted
selection of indicators used in the present report points to
movements away from targets in the transport and energy sectors; in
both sectors price incentives run counter to the targets. In
agriculture, the indicators suggest continued intensification on
the one hand and an increase in agri-environmental management (in
limited areas) on the other.
Integration of the environment in sectoral
policies was already mentioned in the fifth environmental action
programme as a main policy concern. The European Council in Cardiff
gave the impetus to the practical organisation of developing
integration strategies and the related reporting on progress.
Progress by sector is assessed in the following chapters, based on
a restricted set of indicators. This chapter attempts to assess how
the various sectors are progressing compared to each other.
Although the sectors differ considerably, some
common features in the integration process can be identified (EEA,
1999a and 1999b):
- What are the determining characteristics
in the size and shape of the sector with regard to the
environment? How have these developed over time? For example, the
main issue for transport is the development of total mobility and
division between the various forms of transport; for energy, the
concerns are the development of energy use and the choice between
fossil fuels, renewables and nuclear energy; for agriculture, the
main characteristics are the amount of agricultural production and
the produc- tion system used.
- How have the sector's beneficial and
harmful influences on the environment changed?
- How has the eco-efficiency of
the sector developed, or in other words: is the sector delivering
its products and services with less use of resources and
energy and less pollution per unit of output?
- What has been the progress in
implementing integration measures: market integration,
management integration and institutional integration?
2.1. Progress towards integration
Developments in the size and shape of the
sectors show a mixed picture. In transport, there is a clear trend
away from policy targets: passenger and goods transport have
increased steadily, with road transport increasing faster than
other forms (see Figures 5.3 and 5.4). Energy shows a similar
picture: the amount of energy used has increased, with fossil-fuel
energy showing the greatest increase and use of renewables
increasing only slowly (see Figures 3.3 and 3.4). In
agriculture, the indicators suggest a split into areas with
continuing intensive farming — with increased fertiliser and
pesticide use per hectare (see Figures 6.3 and 6.5) — and
more areas under special management contracts. For industry, there
is insufficient data for such an assessment, which would need to
take into account worldwide developments in trade and
globalisation.
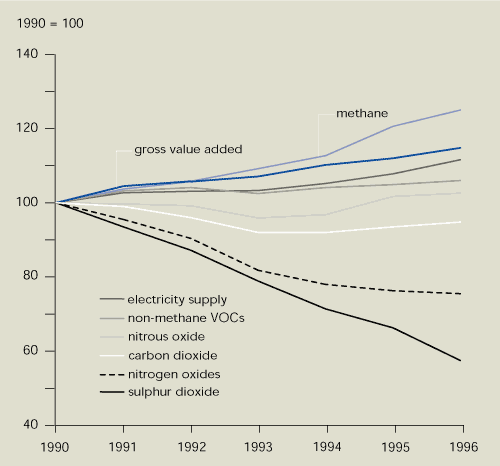
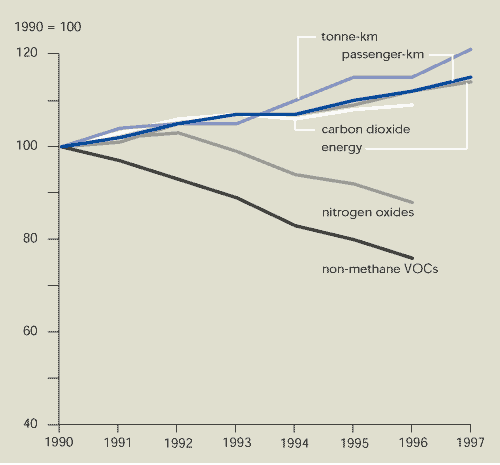
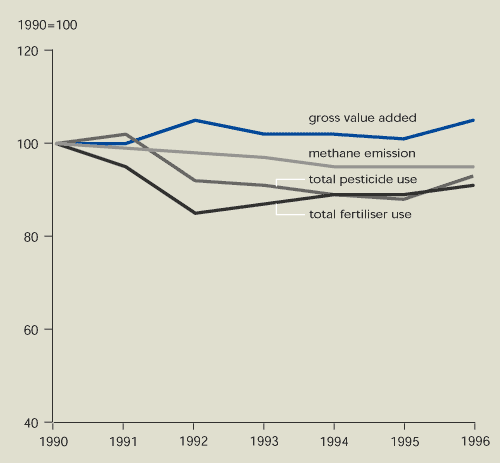
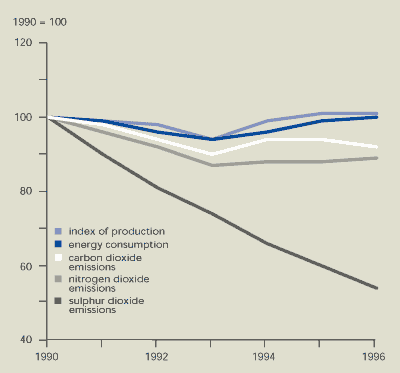
Progress in environmental efficiency shows
common trends in all sectors. Little significant breaking of the
link between developments in production and emissions has yet
occurred, apart from sulphur dioxide emissions (Figure 2.1).
Sulphur dioxide and nitrogen oxide emissions have fallen, but less
progress has been made in reducing carbon dioxide emissions. The
transport sector shows a strong link between transport, energy use
and carbon dioxide emissions. In the energy sector, the slight
breaking of the link between carbon dioxide emissions and output is
mainly due to the shift from coal and oil to natural gas in power
plants, and to increased production of nuclear energy.
Eco-efficiency gains in the crucial sectors of transport and
agriculture have been less than those in industry and energy.
Unfortunately, eco-efficiency assessments are
currently limited to air pollution and a selection of inputs used
in the sectors. Consistent and systematic data on waste production
and other influences on the environment is not yet available.
Figure 2.1.
Eco-efficiency in the four sectors based on
emissions of major air pollutants


Source:
EEA


Source:
EEA
Reporting on progress in the implementation of
typical integration measures is currently limited to the theme of
`getting the price right', i.e. economic instruments. A more
qualitative overview of progress in integration is in preparation
(EEA, 2000b).
Although taxes are a large part of energy
prices, the real price of almost all fuels has fallen during the
past 10 years (Figure 3.5). There is therefore no economic
incentive to save energy. A similar development has taken place in
the transport sector. Data from Denmark and the UK (EEA, 2000a)
shows that the price of public transport has increased more
quickly, and to a higher level, than private transport. The
incentive provided by transport prices thus also opposes policy
aims. More policy initiatives are therefore needed for both energy
and transport to reverse these trends.
In agriculture, economic instruments have been
used for many years via management contracts for environment and
landscape conservation. Compared with the total funds available for
agriculture, these agri-environmental measures are small. There is
far less experience in including the monetary costs of the negative
environmental effects of agriculture in the price of agricultural
products. Only three EU Member States and Norway have introduced
pesticide taxes, and only two (including Norway) a tax on
fertilisers (see Chapter 6). Given the possible trend towards
local intensification of agriculture, taxes and levies on
agricultural inputs and outputs may become more important in the
future.
The industrial sector is mainly confronted with
levies, which are not included in available statistics on taxes
(see Chapter 15). Most of these levies are directed towards the
outputs of industrial processes and, as in the agricultural sector,
taxes on inputs (resource taxes) are not common.
2.2. References and further reading
EEA (1999a). Environment in the European
Union at the turn of the century. European Environment Agency,
Copenhagen.
EEA (1999b). Towards a common framework for
the assessment of progress in environment-sector integration.
(In preparation). Technical report. European Environment Agency,
Copenhagen.
EEA (2000a). Are we moving in the right
direction? Indicators on transport and environment integration in
the EU. (In preparation). European Environment Agency,
Copenhagen.
EEA (2000b). Monitoring progress towards
integration. (In preparation). European Environment Agency,
Copenhagen.


Document Actions
Share with others