13. Eutrophication
| indicator |
policy issue |
DPSIR |
assessment |
| nitrogen and phosphorous
concentrations in rivers |
do we see the results of nutrient
policies in rivers? |
state |
 / /  |
| nitrogen run-off |
what have been the main
contributions to the total load of nitrogen? |
pressure |
 |
| nitrogen balance |
has agriculture balanced its
inputs and ouputs of nutrients? |
pressure |
 |
| phosphorous load |
what have been the main
contributions to the total load of phosphorous? |
pressure |
 |
| discharge of phosphorous from
urban wastewater treatment plants |
what has been the result of the
urban wastewater directive and national measures? |
pressure |
 |
| wastewater treated |
- " - |
response |
 |
| nitrate concentrations in
groundwater |
how often are groundwater quality
aims for nitrogen exceeded? |
state |
 |
| phosphorous concentrations in
lakes |
do we see the results of a
decrease in phosphorous emissions? |
state |
 |
| phosphate concentrations in
coastal water |
do we see the results of nutrient
policies in coastal waters? |
state |
 |
| nitrate concentrations in coastal
water |
- " - |
state |
 |
Measures to reduce nutrient pollution of
water bodies have been implemented with varying degrees of success.
The Urban Waste Water Directive and investment by EEA member
countries in nutrient removal have reduced phosphorus discharges.
Nitrogen pollution has been reduced to a far lesser extent, with
the nitrogen surplus from agriculture staying at the same
concentration as in 1990. Phosphorus concentrations in major rivers
have fallen significantly over the last 15 years, but nitrate
concentrations have remained constant and high. Nitrate
concentrations in many groundwater supplies exceed limits set by
the Drinking Water Directive. Phosphorus concentrations in severely
affected lakes have fallen significantly. Nutrient concentrations
in coastal waters show little overall improvement.
13.1. What is eutrophication?
The overloading of seas, lakes, rivers and
streams with nutrients (nitrogen and phosphorus) can result in a
series of adverse effects known as eutrophication. Phosphorus is
the key nutrient for eutrophication in fresh waters and nitrate is
the key substance for salt waters.
In severe cases of eutrophication, massive
blooms of algae (sessile and planktonic) occur. Some blooms are
toxic. As dead algae decompose, the oxygen in the water is used up;
bottom-dwelling animals die and fish either die or leave the
affected area. Increased nutrient concentrations can also lead to
changes in the aquatic vegetation. The unbalanced ecosystem and
changed chemical composition make the water body unsuitable for
recreational and other uses, and the water becomes unacceptable for
human consumption. High concentrations of nitrate in drinking water
are considered a human-health problem because in the stomach
nitrate is converted rapidly to nitrite, which can cause a
reduction in the blood’s oxygen-carrying capacity.
The main source of nitrogen pollution is
run-off from agricultural land, whereas most phosphorus pollution
comes from households and industry. The rapid increase in
industrial production and household consumption during the 20th
century has resulted in greater volumes of nutrient-rich
wastewater. Nutrient removal during wastewater treatment in
sewage-treatment plants is vital to minimise the impact of nitrogen
and phosphorus pollution on Europe’s water bodies.
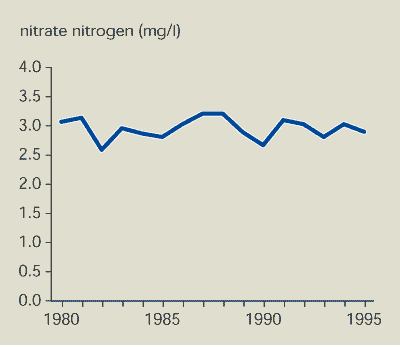
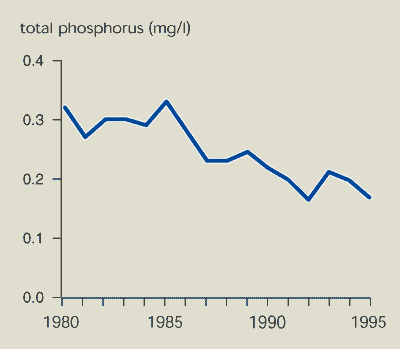
Since 1980, nitrate concentrations in major EU
rivers have been about constant (Figure 13.1). There is no evidence that
reduced application of nitrogen fertilisers to agricultural land
has resulted in lower nitrate concentrations in rivers. The decline
in phosphorus concentrations in major EU rivers is due to improved
wastewater treatment and less phosphorus in household
detergents.
Figure 13.1:
Nitrogen and phosphorus in major EU
rivers
Source:
EEA-ETC/IW based on country returns under EC Exchange of
Information Decision (77/795/EEC)
Note:
Median of indexed values of concentrations of nitrate nitrogen and
total phosphorus at 92 locations.
 Nitrate concentrations have been largely unchanged since
1980.
 Phosphorus concentrations in some EU rivers have fallen since the
mid-1980s, particularly in the largest and most polluted
rivers.
13.2. Controls of nutrient discharges
Control of point-source discharges varies
between EU Member States. However, some improvement is likely as
Member States invest in new infrastructure in order to comply with
the Urban Waste Water Treatment Directive. This requires Member
States to provide urban areas with sewage collection and wastewater
treatment systems. In sensitive areas, nutrient removal is required
as part of a more advanced treatment programme. Since May 1999 all
Members States have fully or partly transposed this Directive into
their national laws and developed implementation plans – in most
cases with considerable delay. There are indications that it will
be possible to reach the deadlines for achieving the environmental
objectives of the Directive, although for Brussels and Milan much
remains to be done.
Controls have been most effective for major
point sources, such as urban wastewater and industrial effluents,
and where nutrient use has been restricted or banned, e.g.
phosphate in detergents. However, many small point sources are not
covered effectively by current legislation and are likely to
discharge into small rivers where they can have a significant
negative impact.
Efficient control of diffuse sources such as
nitrate run-off from agriculture has rarely been achieved.
Fertiliser use and nutrient loads from manure have fallen since the
1980s, mainly due to the effects of CAP reforms. Nutrient inputs to
water bodies from agriculture are still too high. Implementation of
the Nitrate Directive has been unsatisfactory in most Member States
and the Commission has begun legal action against those Member
States that have not yet complied.
Although phosphorus pollution from point
sources has fallen, it may be necessary to take measures to reduce
diffuse loads from agricultural areas — particularly in areas where
the soil’s absorption capacity for phosphorus is exceeded.
13.3. Nitrogen flows
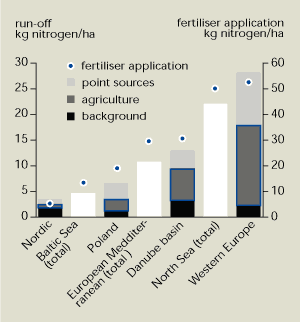
Comparison of nitrogen run-off with the
application of fertiliser shows that diffuse sources – particularly
agriculture – dominate (Figure
13.2). Human activities account for less than half the nitrogen
discharged in the Nordic countries, where about 7 % of the land is
cultivated and population density is low. Most comes from run-off
from forested and uncultivated areas.
Those areas with the five highest amounts of
nitrogen run-off in Figure 13.2
have similar amounts (40-50 %) of arable land. The marked increase
in run-off from 6.5 kg/hectare in Poland to 28 kg/hectare in
western Europe is due to more intensive agriculture – as shown by
the higher rates of fertiliser application.
Figure 13.2:
Nitrogen run-off and fertiliser application
in selected European areas, latest available year between 1988 and
1996
Source:
EEA-ETC/IW
Note: All
areas greater than 300 000 km2. Run-off and fertiliser
application per hectare of total land area.
 Agriculture is the main source of nitrate pollution. Nitrogen
run-off in areas with intensive agriculture is over 5, and often
more than 10 times higher, than that from forested areas.
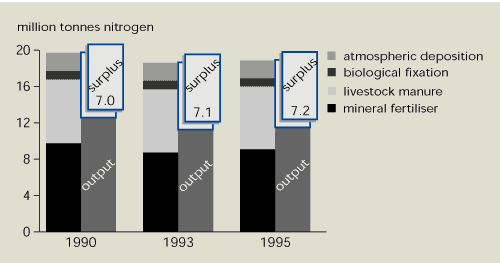
The two main nitrogen inputs to agricultural
land are mineral fertilisers and manure. Between 1990 and 1995, the
total input in the first 12 EU Member States fell by around 5 % (Figure 13.3). However, there was a
similar decrease in nitrogen removal by harvested crops (i.e.
output). Surplus nitrogen – a source of pollution – remained almost
constant at 7.2 .7.4 million tonnes. Nitrogen surpluses in EU
Member States for 1990, 1993 and 1995 are shown in Table 13.1. The
nitrogen balance in the 15 EU Member States is only available for
1995, but is almost identical to that for the 12 Member States
included in Figure 13.3.
Figure 13.3:
Nitrogen balance for agricultural soil in EU
Member States, 1990-1995
Source:
Eurostat
Note:
Based on data from the first 12 EU Member States.
 About a third of nitrogen applied to agricultural land is not
removed with the harvest.
13.4. Phosphorus flows
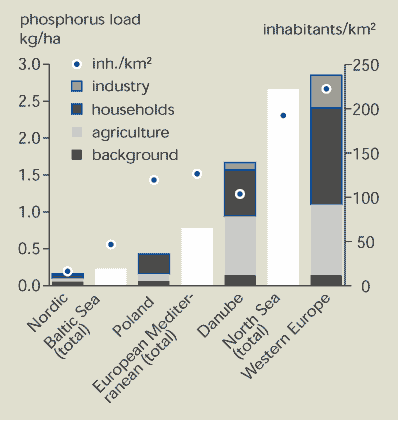
Figure 13.4
shows that the annual phosphorus load per hectare area increases
with population density. In relatively sparsely populated areas
with low agricultural activity, such as the Nordic countries, only
half the phosphorus loading is due to human activities. The other
half comes from diffuse run-off from forested and uncultivated
land. For example, in the Baltic Sea catchment area where the
population density is less than 50 inhabitants/km2, the phosphorus
load is 0.23 kg/hectare. In the North Sea catchment area, the
population density is about 200 inhabitants/km2 and the phosphorus
load is 2.7 kg/hectare.
Figure 13.4:
Sources of phosphorus in selected European
countries and catchment areas, latest available year between 1988
and 1996
Source:
EEA-ETC/IW
Note: All
areas greater than 300 000 km2.
 Households and industry are the biggest contributors of
phosphorus to the environment. However, in those parts of Europe
with intensive agriculture, the contribution from agriculture
approaches 50 % of the total.
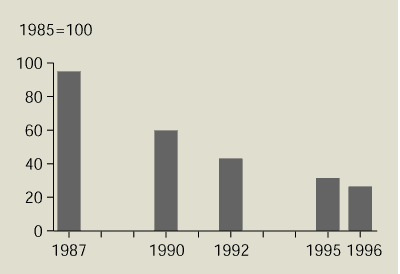
Over the past 15 years, phosphorus discharges
from urban wastewater treatment plants in many countries in
north-west Europe have fallen by 50-80 % (Figure 13.5). The main reason for this
reduction is the upgrading of wastewater treatment plants to
include phosphorus removal. The shift to phosphate-free detergents
has also contributed.
Figure 13.5:
Discharge of phosphorus from urban
wastewater treatment plants in north-west Europe
Source:
EEA-ETC/IW
Note: Data from Denmark, Finland, the Netherlands, Norway,
Sweden and North Rhine–Westphalia (Germany).
 Total phosphorus discharges from urban wastewater treatment plants
in north-west European countries have fallen significantly during
the past 15 years.
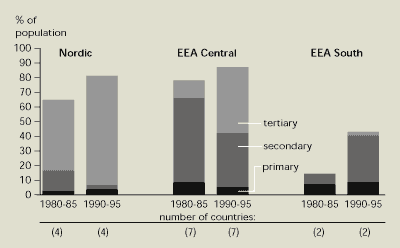
During the same period, marked changes have
occurred both in the proportion of the population connected to the
sewerage system and in wastewater treatment technologies (Figure 13.6). In northern and central
European countries, most of the population was connected to the
sewerage system and a wastewater treatment plant by the early
1980s. In southern countries, the population connected to sewers
has increased significantly – but by 1995 only about half had their
wastewater treated.
In the 1980s, secondary treatment (i.e.
biological removal of oxygen-consuming substances) became common in
western countries. However, countries like Finland and Sweden were
already using tertiary treatment (i.e. nutrient removal) as well.
Many western European countries built treatment plants with
nutrient removal in the late 1980s and the 1990s.
Figure 13.6:
Developments in wastewater treatment in
European regions between 1980-85 and 1990-95
Source: Eurostat
and national information
Notes: Nordic: Finland, Iceland, Norway and Sweden. EEA
Central: Austria, Denmark, Germany, Ireland, Luxembourg, the
Netherlands and the UK. EEA South: Greece and Spain.
 Nordic and central European countries have the highest percentage
of wastewater subject to tertiary treatment (particularly
phosphorus removal).
13.5. Nutrients in ground and surface waters
13.5.1. Nitrate in groundwater
When nitrate is washed out of agricultural
soil, it first contaminates shallow groundwater. At a later stage,
deeper groundwater in vulnerable positions is affected, e.g. parts
of the UK with fractured limestone with thin soil cover and the
eastern Netherlands with its sandy soils and severe nitrogen
loading. Most groundwater supplies in the EU are from deep wells
and are therefore not immediately affected by high nitrate
concentrations. In areas where the nitrogen concentrations in
groundwater are high and the water is obtained from shallow
groundwater sources (the usual practice for private and small
communal supplies), the population can be at risk.
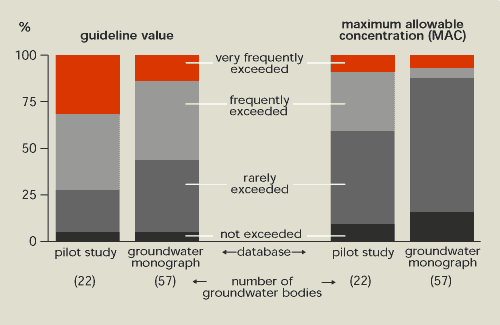
Figure 13.7
shows that the Drinking Water Directive guideline value of 25 mg
nitrate/litre for drinking water is exceeded at over half the
groundwater sampling sites used in the compilation of two EEA
databases. The maximum allowable concentration (MAC) is exceeded at
around a quarter of the sampling sites.
Figure 13.7:
Nitrate concentrations in groundwater,
latest available year between 1990 and 1996
Source:
EEA-ETC/IW
Notes: Percentage of groundwater bodies where the guide value
and the MAC are exceeded: very frequently (>50 % of sites);
frequently (>25 %); rarely (0–25 %); and not at all. Numbers in
brackets indicate the number of administrative authorities
responsible for the groundwater bodies in the database.
 The Drinking Water Directive guideline value and the maximum
allowable concentration for nitrate in drinking water are exceeded
in many EU groundwater supplies.
13.5.2. Phosphorus in lakes
Like rivers (Figure 13.1), phosphorus concentrations
in many lakes have fallen (Figure
13.8). This is particularly true for lakes that had high
concentration in the early 1980s. The improvement is due to better
wastewater treatment and use of phosphate-free detergents.
Diverting wastewater away from the lake is another frequently used
method of reducing external loading.
Despite considerable reduction in phosphorus
inputs from point sources, many lakes have not yet shown the
expected environmental improvement. The main reason for this is
accumulation and release of phosphorus from the lake bottom or
continued contamination from scattered dwellings and agricultural
sources.
Figure 13.8:
Phosphorus in lakes
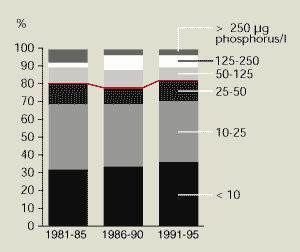
Source: EEA- ETC/IW
Note: Number of lakes: Finland 71; Denmark 13; Ireland 6; Sweden
6; Austria 5; Germany 5; France 4; Norway 4; the Netherlands 2.
 Lakes that had high phosphorus concentrations (>50 µg/litre) in
the early 1980s have lower concentrations today. However, only
slight changes in phosphorus concentrations have been observed in
less-affected lakes.
| Fishing for clean water |
|
In cases of eutrophication, depth of visibility is one of the
best indicators of lake condition. Shallow healthy lakes should
have plants growing on the lake bottom, providing refuge for animal
plankton from fish. The animal plankton keep plant plankton under
control, thus preventing the harmful algal blooms characteristic of
eutrophication. To become established and survive, however,
underwater plants need high water clarity.
In Denmark, Lake Væng still showed the symptoms of severe
eutrophication in 1986 despite a 63 % reduction in phosphorus
inputs from 1982. Between 1986 and 1988, half the population of
fish feeding on animal plankton were caught. This manipulation of
the food chain resulted in an increase in the numbers of animal
plankton grazing on the plant plankton and a corresponding decrease
in plant plankton. Water visibility improved as the plant plankton
were kept under control, leading to the establishment of underwater
plants. The amount of plant plankton in the lake has remained low
and stable, indicating a sustainable and clean lake environment
with fewer signs of eutrophication than before the fish were
removed.
Source: EEA,
1999c
|
13.6. Phosphorus in coastal waters
All signatories to the Third International
Conferences on the Protection of the North Sea achieved the
Conferences’ objective of reducing phosphorus inputs to surface
waters by 50 % between 1985 and 1995 (Andersen and Niilonen, 1995).
However, this reduction is not yet reflected in overall phosphate
concentrations in coastal waters.
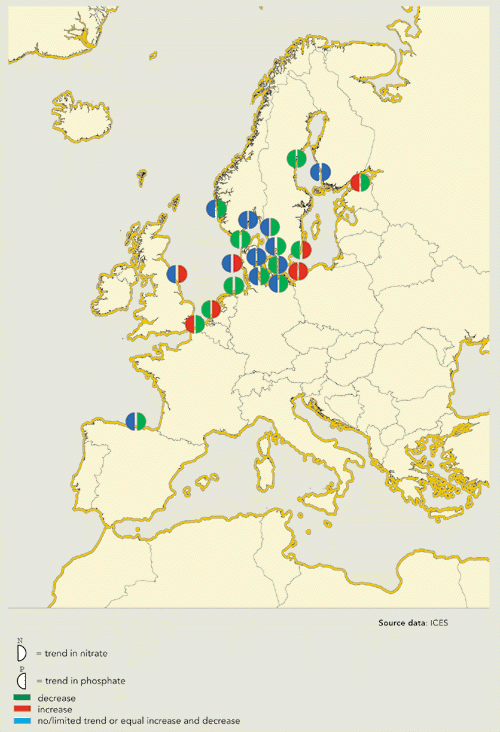
In most coastal waters, there has been zero or
limited change in phosphate concentration (Figure 13.9, 13.10). However, the reduced phosphate
content of detergents and other measures in the catchment area have
resulted in a fall in phosphate concentrations in parts of the
coastal zones in some regions, e.g. the Skagerrak,Kattegat, the
German Bight and the Dutch coastal zone. The average decrease in
phosphate concentration of 46 % in these areas reflects the
reduction in inputs. Reduced phosphorus loads in the River Rhine
have resulted in an average 50 % reduction in concentrations in the
Dutch coastal zone since 1985 and less phytoplankton biomass.
Present phosphate concentrations in the area are still 2 .3 times
higher than marine background concentrations (De Vries et
al, 1998). In the Gulf of Finland, leaching from sediment has
caused phosphate concentrations to increase recently. In general,
the presence of a large buffer of phosphorus in coastal sediments
is the main reason why the reduction in phosphate inputs has not
been reflected immediately by a reduction in phosphate
concentrations.
Figure 13.9:
Changes in phosphate concentration in OSPAR
and HELCOM coastal waters, 1985-1998
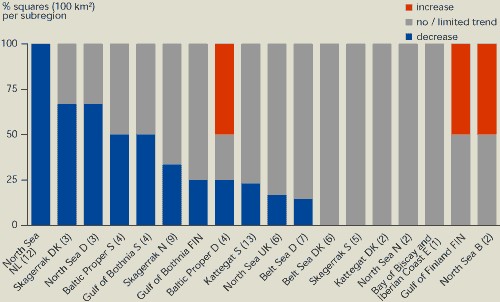
Source: ICES;
Finnish National Focal Point
Notes:
Trend in winter phosphate concentrations expressed as a percentage
of squares (10×10 km) in coastal waters of OSPAR and HELCOM
countries within the EU and Norway. The total number of squares in
each area is given in brackets. The category 'no/limited trend'
indicates a trend between +10 % and -10 %. The methodology for the
aggregation of squares in each region in given by Van Buuren et
al. (draft)
 Most coastal waters show little or no change in phosphate
concentrations. However, there is a substantial decrease in 35 % of
OSPAR and HELCOM coastal waters within the EU and Norway.
Figure 13.10:
Nitrate and phosphate concentrations in
Atlantic, North Sea and Baltic coastal waters, 1985-1996
13.7. Nitrogen in coastal waters
No signatory state to the Third International
Conferences on the Protection of the North Sea achieved the
Conferences’ objective of reducing nitrogen inputs to surface
waters by 50 % between 1985 and 1995. However, all North Sea States
are expected to have reached a substantial reduction of nitrogen
inputs to surface waters of around 25 % (Andersen and Niilonen,
1995).
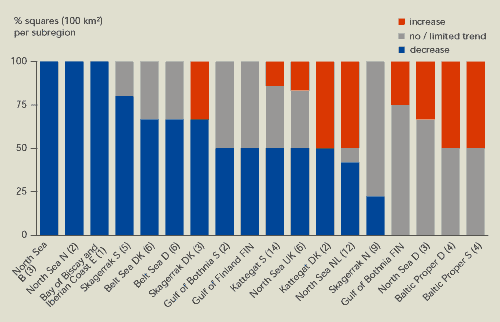
Figure 13.11
shows a gradual reduction in nitrate concentrations in coastal
waters for 48 % of the 10 km2 squares in each
sub-region. A 100 % decrease was found only in sub-regions with up
to three squares per sub-region; this might therefore be due to the
limited data available. The mean decrease in nitrate concentration
is around 25 %. Part of the decrease appears to be due to very low
run-off into rivers in 1996 and 1997.
About 20 % of the squares in each sub-region
show an increase in nitrogen concentration. These are mainly
sub-regions of the Baltic Sea, Kattegat and Skagerrak, where the
increased nitrate concentrations are probably related to internal
fluxes (remineralisation of nitrogen).
Figure 13.11:
Changes in nitrate concentration in OSPAR
and HELCOM coastal waters, 1985-1998
Source: ICES;
Finnish National Focal Point
Notes:
Trend in winter nitrate concentrations expressed as a percentage of
squares (10×10 km) in coastal waters of OSPAR and HELCOM countries
within the EU and Norway. The total number of squares in each area
is given in brackets. The category 'no/limited trend' indicates a
trend between +10 % and -10 %. The methodology for the aggregation
of squares in each region in given by Van Buuren et al.
(draft)
 Nitrate concentrations in coastal waters fell in nearly half
OSPAR and HELCOM coastal waters within the EU and Norway between
1985 and 1998. However, there were also some increases.
13.8. Indicator improvement
An ideal pressure indicator for eutrophication
would be the total emissions of nutrients to waters and to the
atmosphere by country and by source (point and diffuse). OSPARCOM
is developing guidelines for the measurement and calculation of
such emission data for nutrients.
When fully implemented, the EEA’s water
information and monitoring network, Eurowaternet, will provide
information on water quality and quantity issues for different
types of water bodies. Information will also be gathered on the
status and trends in the quality and quantity of Europe’s inland
water resources and how these relate and respond to driving forces
and pressures on the environment.
For the future, impact indicators on
eutrophication (e.g. algae blooms, oxygen deficiency, changes in
macrophyte and bottom animal communities) should be developed. Also
indicators and analysis of the effectiveness of response measures
such as the Urban Waste Water Treatment Directive and the Nitrates
Directive against the costs of implementation, will be needed.
| Table 13.1: Nitrogen surplus in
agricultural areas of EU Member States, 1990-1995 |
| Unit: kg nitrogen/ha
utilised agricultural area (UAA) |
| |
1990 |
1993 |
1995 |
| Austria |
|
|
16 |
| Belgium |
106 |
109 |
103 |
| Denmark |
93 |
92 |
72 |
| Finland |
|
|
51 |
| France |
47 |
54 |
57 |
| Germany |
105 |
101 |
102 |
| Greece |
84 |
61 |
58 |
| Ireland |
47 |
60 |
62 |
| Italy |
62 |
83 |
76 |
| Luxembourg |
124 |
124 |
121 |
| Netherlands |
229 |
212 |
213 |
| Portugal |
27 |
23 |
22 |
| Spain |
40 |
37 |
37 |
| Sweden |
|
|
38 |
| UK |
40 |
39 |
40 |
| EU 12/15 |
60 |
60 |
60 |
| Source: Eurostat |
Note: Surplus
calculated as balance of inputs (mineral fertilisers, manure,
biological fixation and atmospheric deposition) and outputs
(harvested crops). Total average in EU 12 given for 1990 and 1993,
and for EU 15 for 1995.
13.9. References and further reading
Andersen, J. and Niilonen, T. Eds. 1995.
Progress report. Fourth international conference on the protection
of the North Sea. Ministry of the Environment and Energy,
Danish Environmental Protection Agency, Copenhagen.
Borum, J. 1996. ‘Shallow waters and land/sea
boundaries’ in Eutrophication in Coastal Marine Ecosystems.
Eds: B.B. Jørgensen and K. Richardson. American Geophysical Union.
pp. 179-205.
De Vries, I., Duin, R.N.M., Peeters, J.C.H.,
Los, F.J., Bokhorst, M. and Laane. R.W.P.M. 1998. ‘Patterns and
trends in nutrients and phytoplankton in Dutch coastal waters:
comparison of time-series analysis, ecological model simulation and
mesocosm experiments.’ In ICES Journal of Marine Science
Vol.55, pp. 620-634.
EEA (1999a). Groundwater quality and
quantity in Europe. Environmental assessment report No 3.
European Environment Agency, Copenhagen.
EEA (1999b). Environment in the European
Union at the turn of the century. Environmental assessment
report No 2. European Environment Agency, Copenhagen.
EEA (1999c). Nutrients in European
ecosystems. Environmental assessment report No 4. European
Environment Agency, Copenhagen.
HELCOM (1996). Third periodic assessment of
the state of the marine environment of the Baltic Sea
1989-1993.Balt. Sea Environ. Proc. No. 64 B.
HELCOM. The state of the Baltic marine
environment.
http://www.helcom.fi/
Van Buuren, J., Smit, T., Poot. G., and van
Elteren, A. (draft). Testing of indicators for the marine and
coastal environment in Europe. The development of the ETC/MCE
indicator database. European Environment Agency technical
report, Copenhagen.


Document Actions
Share with others