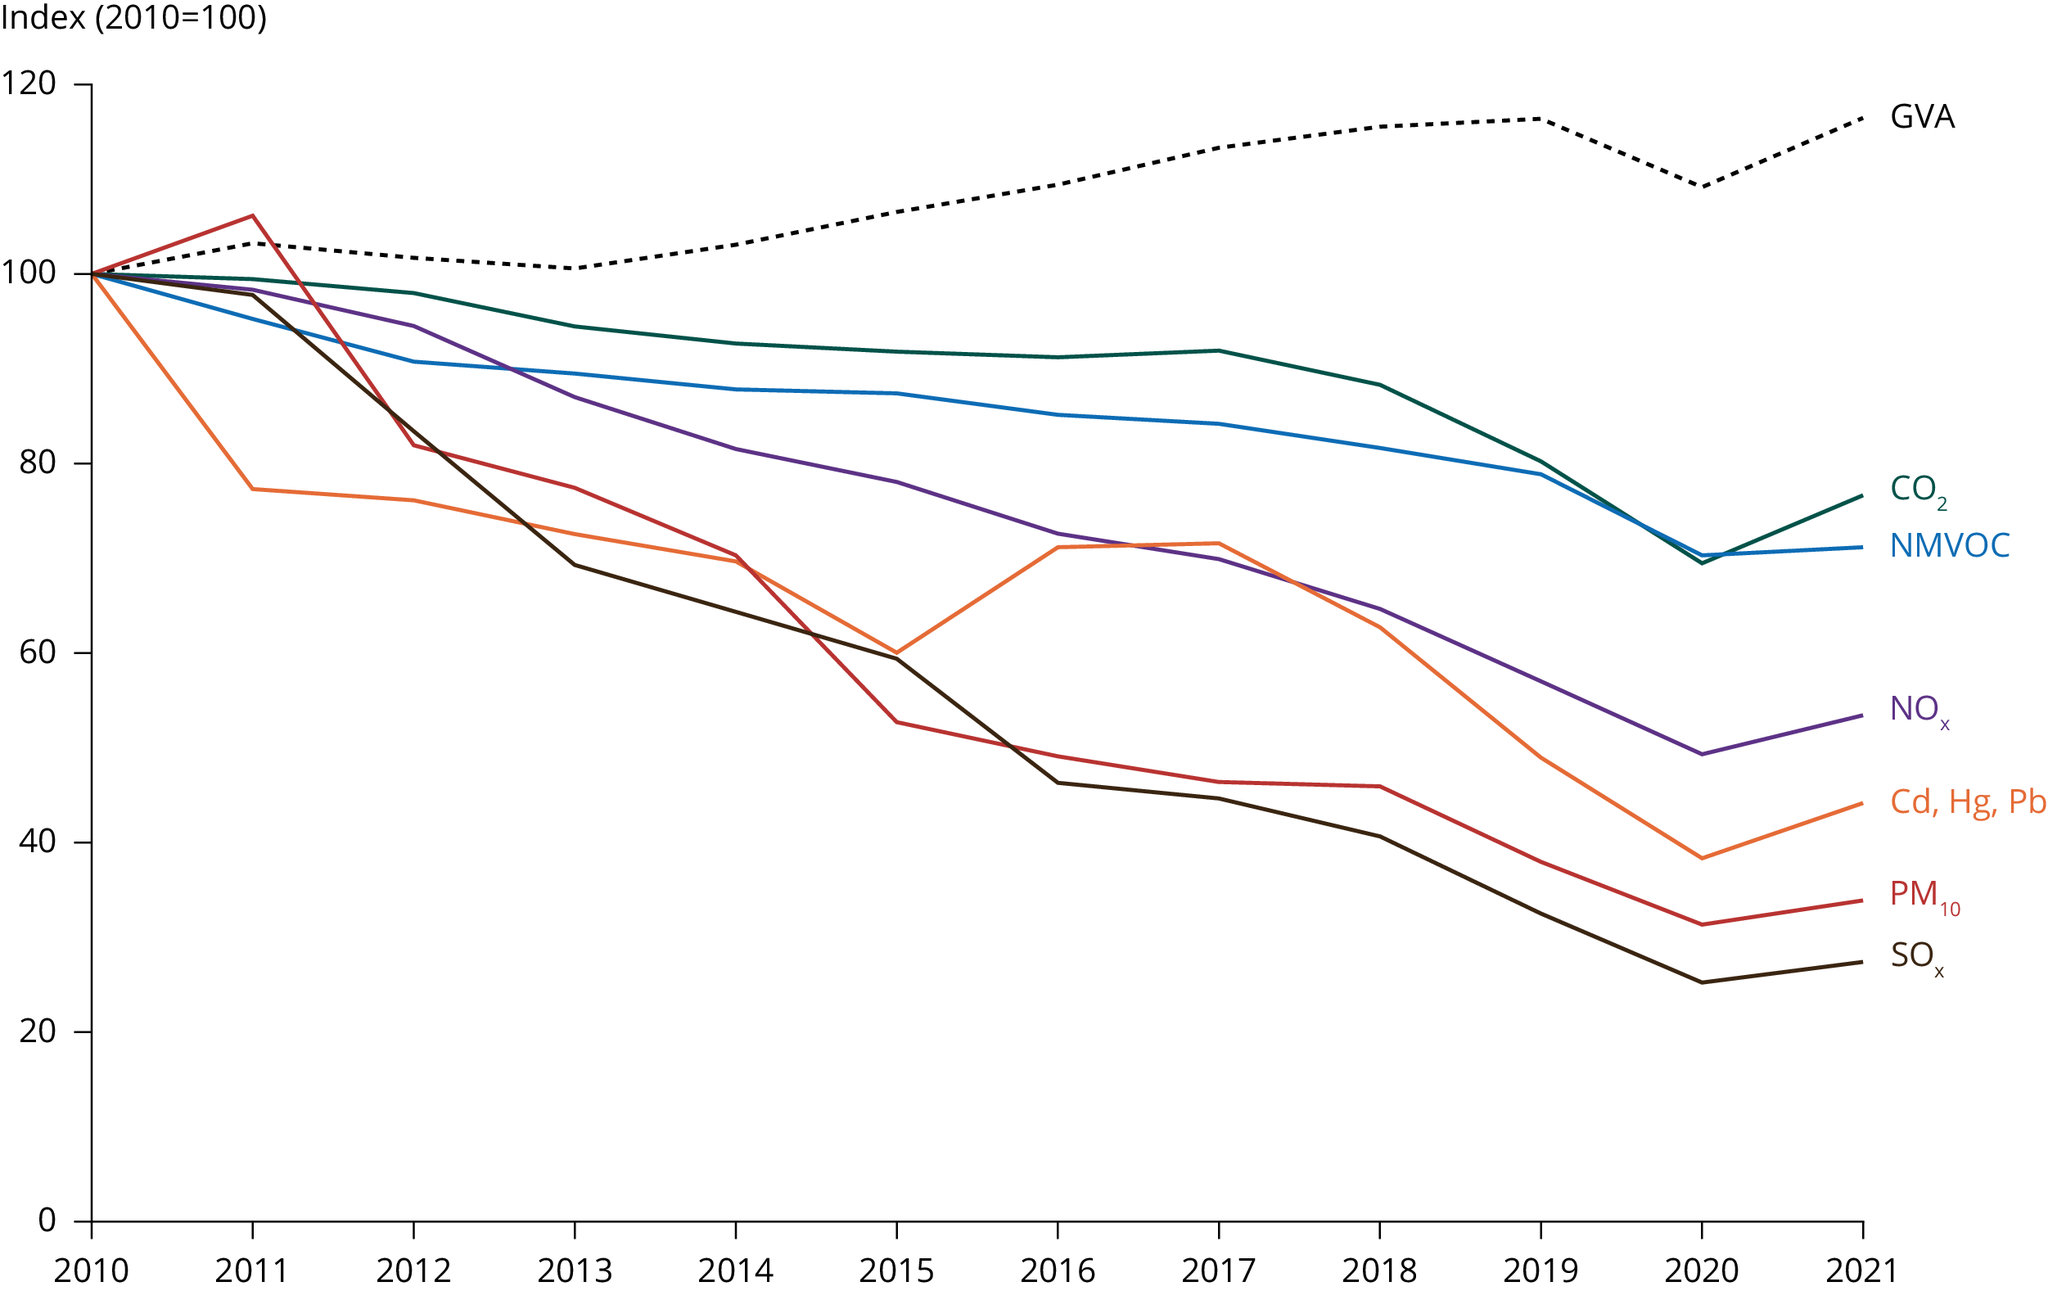
GVA, gross value added; NMVOC, non-methane volatile organic compound; NOx, nitrogen oxides; PM10, particulate matter with a diameter of less than 10 μm; SOx, sulphur oxides. GVA is used as a proxy for the economic activity of industry in Europe, accounting for inflation, based on 2010 values.
Data correction to create EU27 trend:
Latvia: data from old E-PRTR used due to some issues with the mapping of old entities
Slovakia: data from 2017 used to gap fill 2018-2021 due to missing reporting
Malta and Lithuania: data from 2019 used to gap fill 2020-2021 due to missing reporting
Czechia: data from 2020 used to gap fill 2021 due to missing reporting
Netherlands: correction of NOx due to an outlier checked and verified with the country
GVA from EUROSTAT: https://ec.europa.eu/eurostat/databrowser/product/page/NAIDA_10_A10__custom_5231541


Document Actions
Share with others