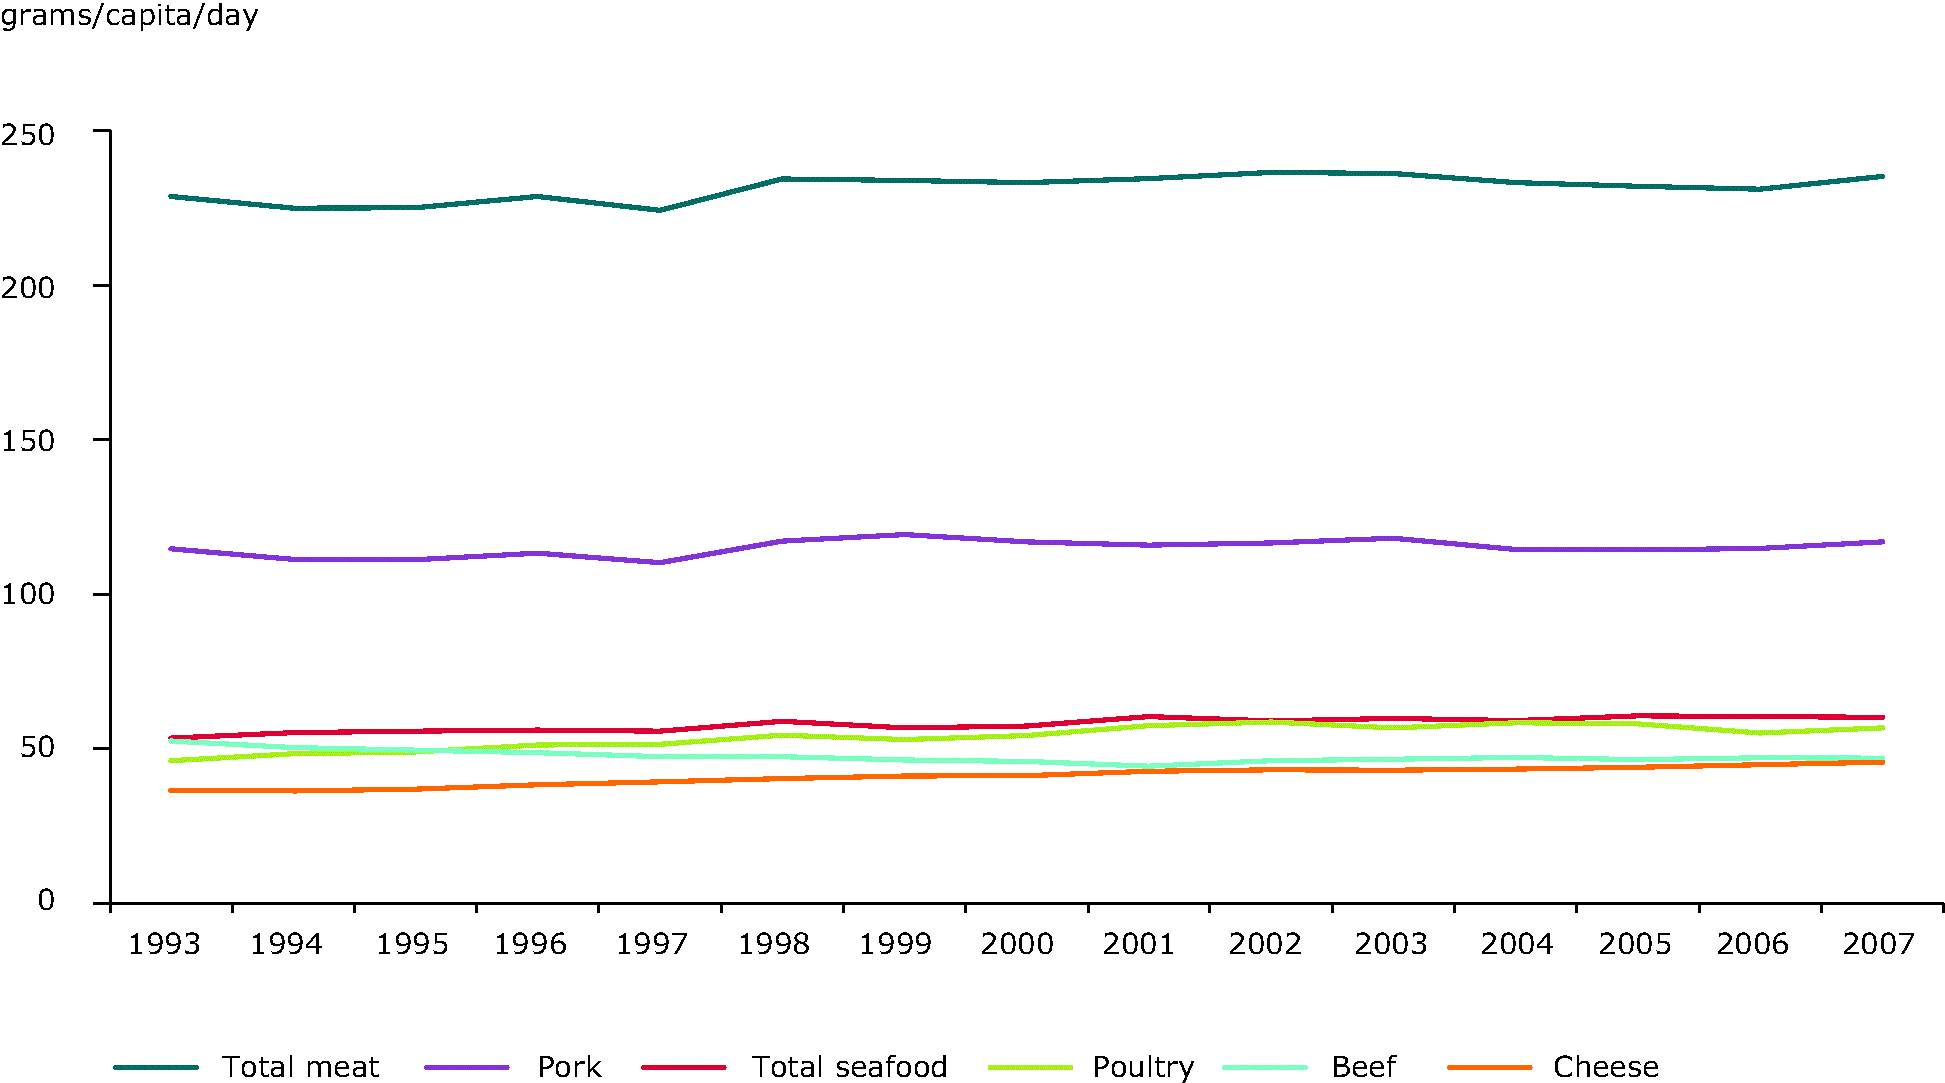
The FAO data on Commodity Balance Sheets are used to calculate food supply per capita/day from 1993 to 2007 (last year available in the FAOSTAT database) for the EU27. The Livestock and Fish Primary Equivalent dataset has been used. The data on 'supply for domestic utilization' correspond to: Production + imports - exports + changes in stocks (decrease or increase). The item 'food' in the dataset comprises the amounts of the commodity in question and of any commodities derived therefrom not further pursued in the food balance sheet that are available for human consumption during the reference period. The quantities of food available for human consumption, as estimated in the food balance sheet, reflect only the quantities reaching the consumer. The amount of food actually consumed may be lower than the quantity shown in the food balance sheet depending on the degree of losses of edible food and nutrients in the household, e.g. during storage, in preparation and cooking (which affect vitamins and minerals to a greater extent than they do calories, protein and fat), as plate-waste, or quantities fed to domestic animals and pets, or thrown away. This supply for food uses is assumed to proxy 'consumption'. Total consumption for all countries is divided by total population of countries with data for each year. This is carried out for EU-27. Figures are then multiplied by 1000 and divided by 365 to convert consumption from kg/capita/year to grams/capita/day


Document Actions
Share with others