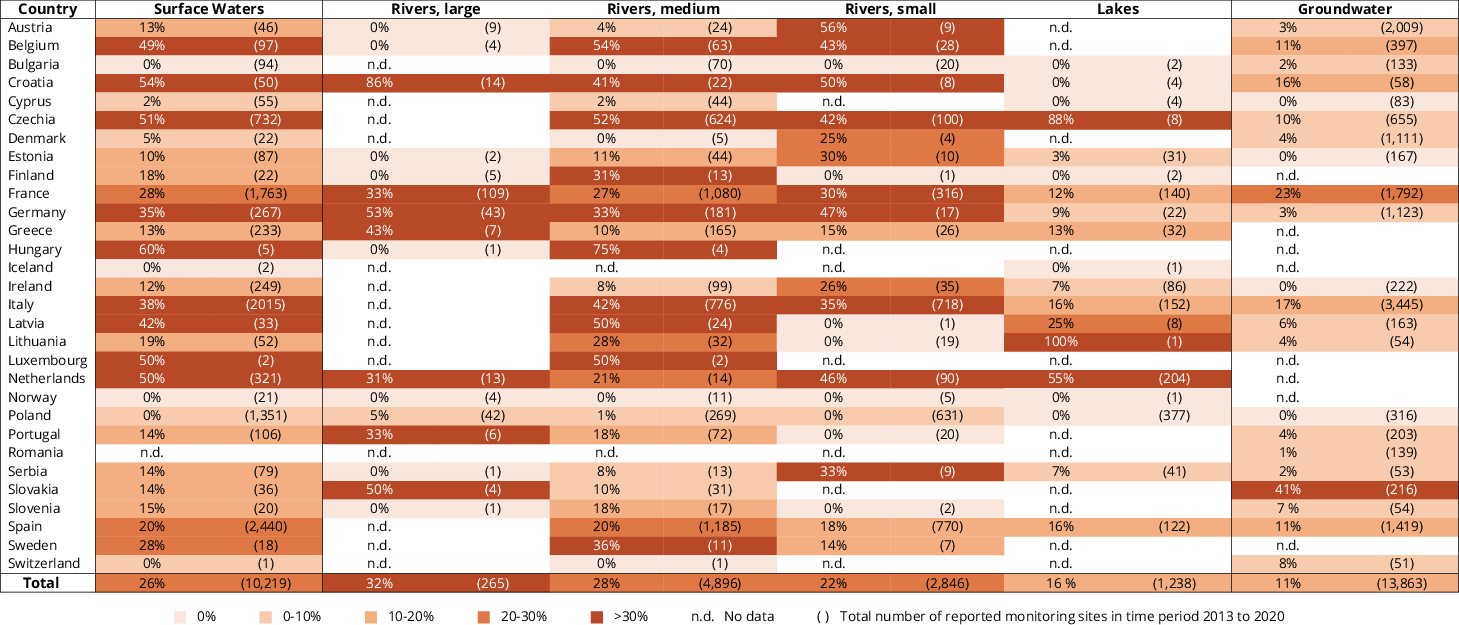
- n.d. = No data
- In brackets: Total number of reported monitoring sites
- The percentage of exceedance rates was calculated based on the number of reported monitoring sites with exceedances, divided by the total number of reported monitoring sites.
- River size could not be assigned to all monitoring sites (so total surface waters does not equal the sum of lakes plus large, medium and small rivers). This issue mainly affects Italy and Spain.
- The WISE Water Framework Directive database was used in the identification of river size.
- EEA-38. Only countries for which data were available are shown.
Further information on the methodology used, including the thresholds used in the assessment of exceedances, is available through the website: https://forum.eionet.europa.eu/nrc-eionet-freshwater/library/pesticides-water/indicator-pesticides-rivers-lakes-and-groundwater-1/2022

 taken in account for the measurement values(s) of the data resource.")
Document Actions
Share with others