All official European Union website addresses are in the europa.eu domain.
See all EU institutions and bodiesAn official website of the European Union | How do you know?
Environmental information systems
EN
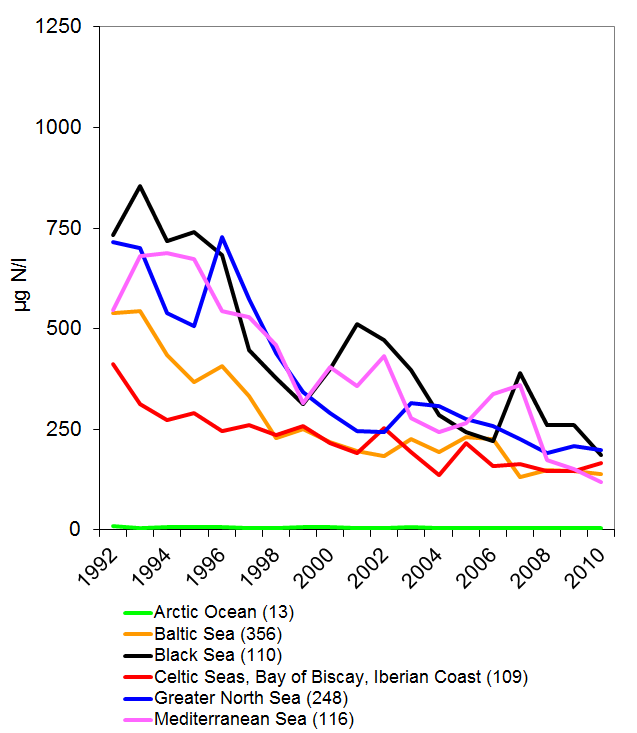
The sea region data series are calculated as the average of annual mean data from river monitoring stations in each sea region. The data thus represents rivers or river basins draining into that particular sea. Only complete series after inter/extrapolation are included (see indicator specification). The number of river monitoring stations included per sea region is given in parentheses.
Loading