next
previous
items

Figure

Projected climatic suitability index for 𝘈𝘦π˜₯𝘦𝘴 𝘒𝘭𝘣𝘰𝘱π˜ͺ𝘀𝘡𝘢𝘴 under RCP.8.5 scenario, NUTS2 level

Figure Created 03 Oct 2022 Last modified 04 Oct 2022
1 min read
The map shows the projected climatic suitability index for 𝘈𝘦π˜₯𝘦𝘴 𝘒𝘭𝘣𝘰𝘱π˜ͺ𝘀𝘡𝘢𝘴 under RCP.8.5 scenario, NUTS2 level. The suitability index of 0 indicates that an area has no favourable environmental conditions for 𝘈𝘦π˜₯𝘦𝘴 𝘒𝘭𝘣𝘰𝘱π˜ͺ𝘀𝘡𝘢𝘴 presence whereas an area with an index of 100 is totally suitable. The climatic suitability index is determined by annual rainfall, summer temperatures and January temperatures. For annual rainfall, the suitability is zero when rainfall is lower than 450 mm; maximum suitability is reached when the annual rainfall is higher than 800 mm. For summer temperatures, the suitability is zero when temperatures are lower than 15Β°C and higher than 30Β°C, and maximum between 20Β°C and 25Β°C. For January temperatures, the suitability is zero when temperatures are lower than - 1Β°C and maximum when temperatures are higher than 3Β°C.

European data

Metadata

Additional information

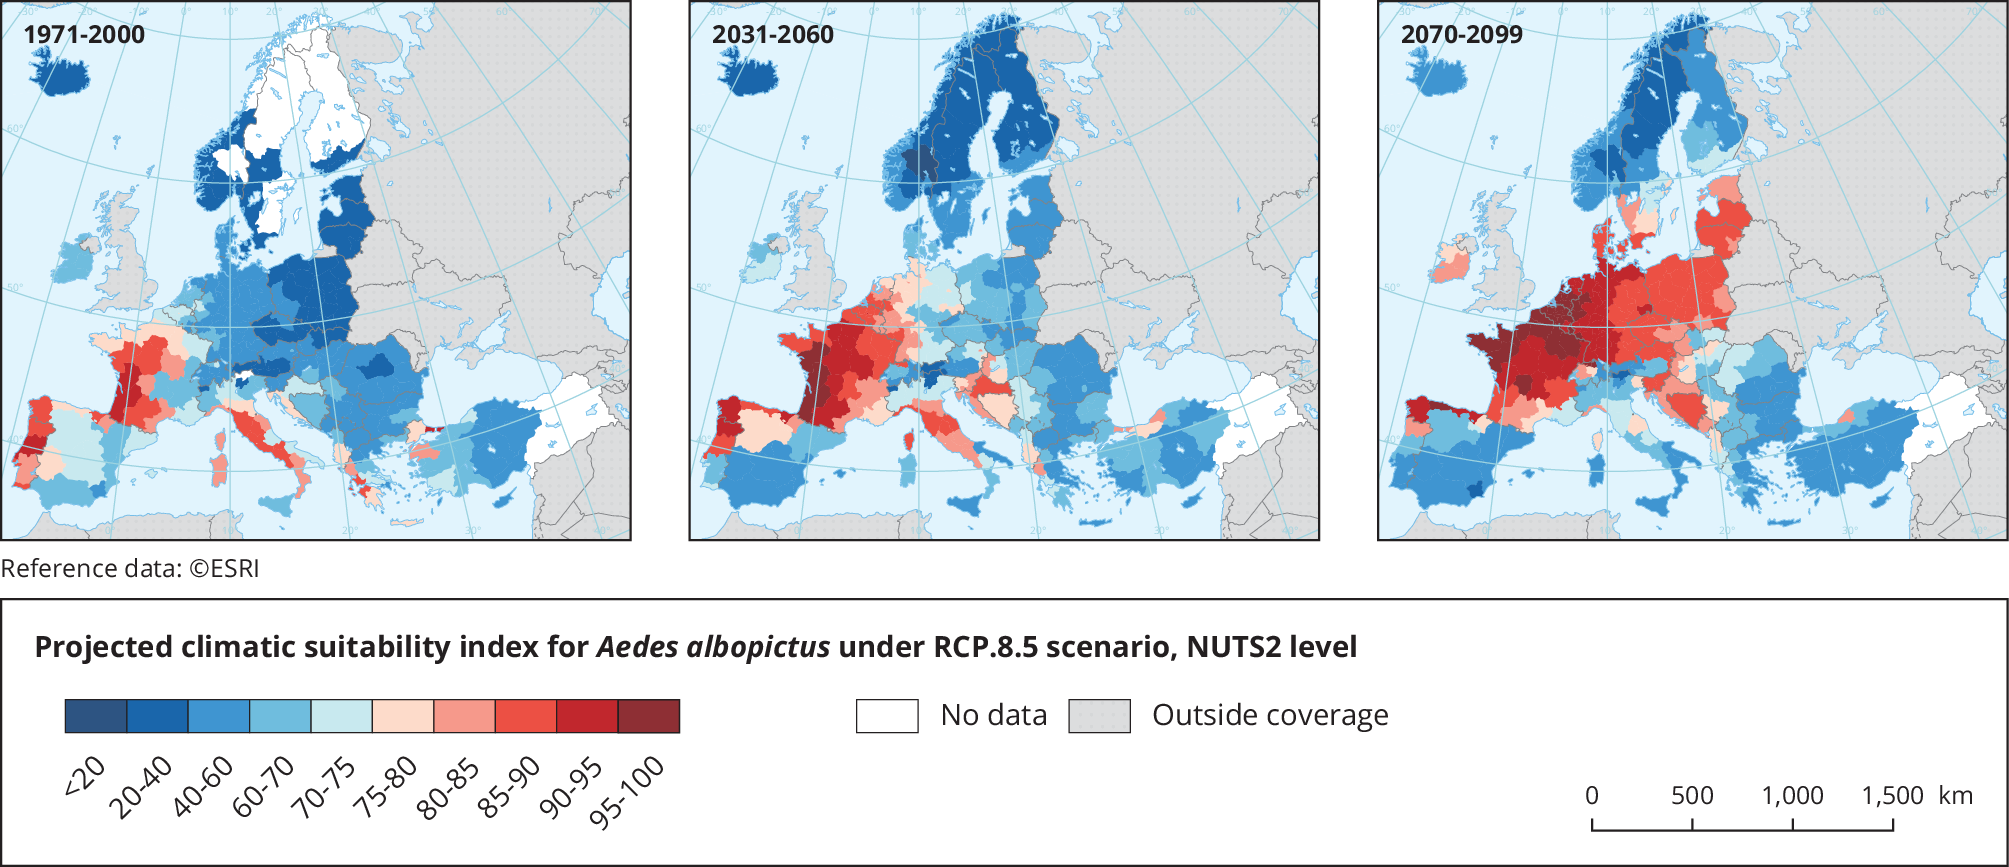
Note: A suitability index of 0 indicates that an area has no favourable environmental conditions for 𝘈𝘦π˜₯𝘦𝘴 𝘒𝘭𝘣𝘰𝘱π˜ͺ𝘀𝘡𝘢𝘴 presence whereas an area with an index of 100 is totally suitable. The climatic suitability index is determined by annual rainfall, summer temperatures and January temperatures. For annual rainfall, the suitability is zero when rainfall is lower than 450 mm; maximum suitability is reached when the annual rainfall is higher than 800 mm. For summer temperatures, the suitability is zero when temperatures are lower than 15Β°C and higher than 30Β°C, and maximum between 20Β°C and 25Β°C. For January temperatures, the suitability is zero when temperatures are lower than - 1Β°C and maximum when temperatures are higher than 3Β°C.
Source: Copernicus Climate Change Service in the European Climate and Health Observatory.

Permalinks

Geographic coverage

Temporal coverage

Document Actions