All official European Union website addresses are in the europa.eu domain.
See all EU institutions and bodies
An official website of the European Union | How do you know?
Environmental information systems
EN

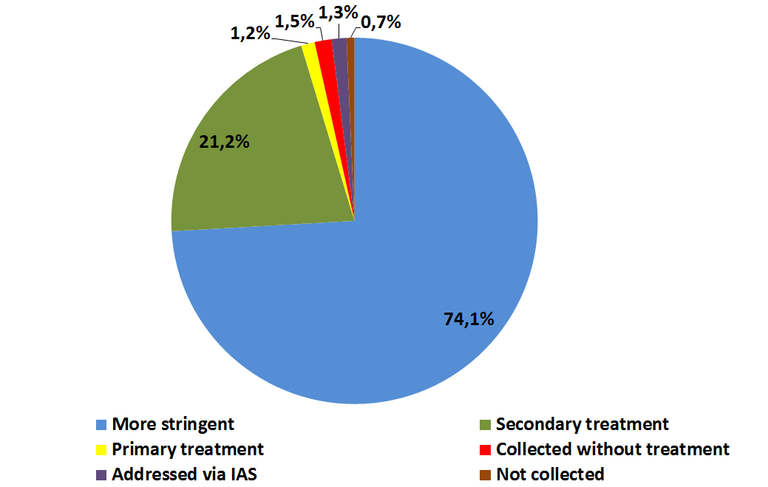
The pie-chart summarizes the type of treatment applied in the wastewater treatment plants of 586 big cities/big dischargers (250,2 mil. p.e.) reported in 2011 by the Member States and Norway. In total 640 big cities and big dischargers was reported, however complete data on waste water pathways was available only for 586.
Loading