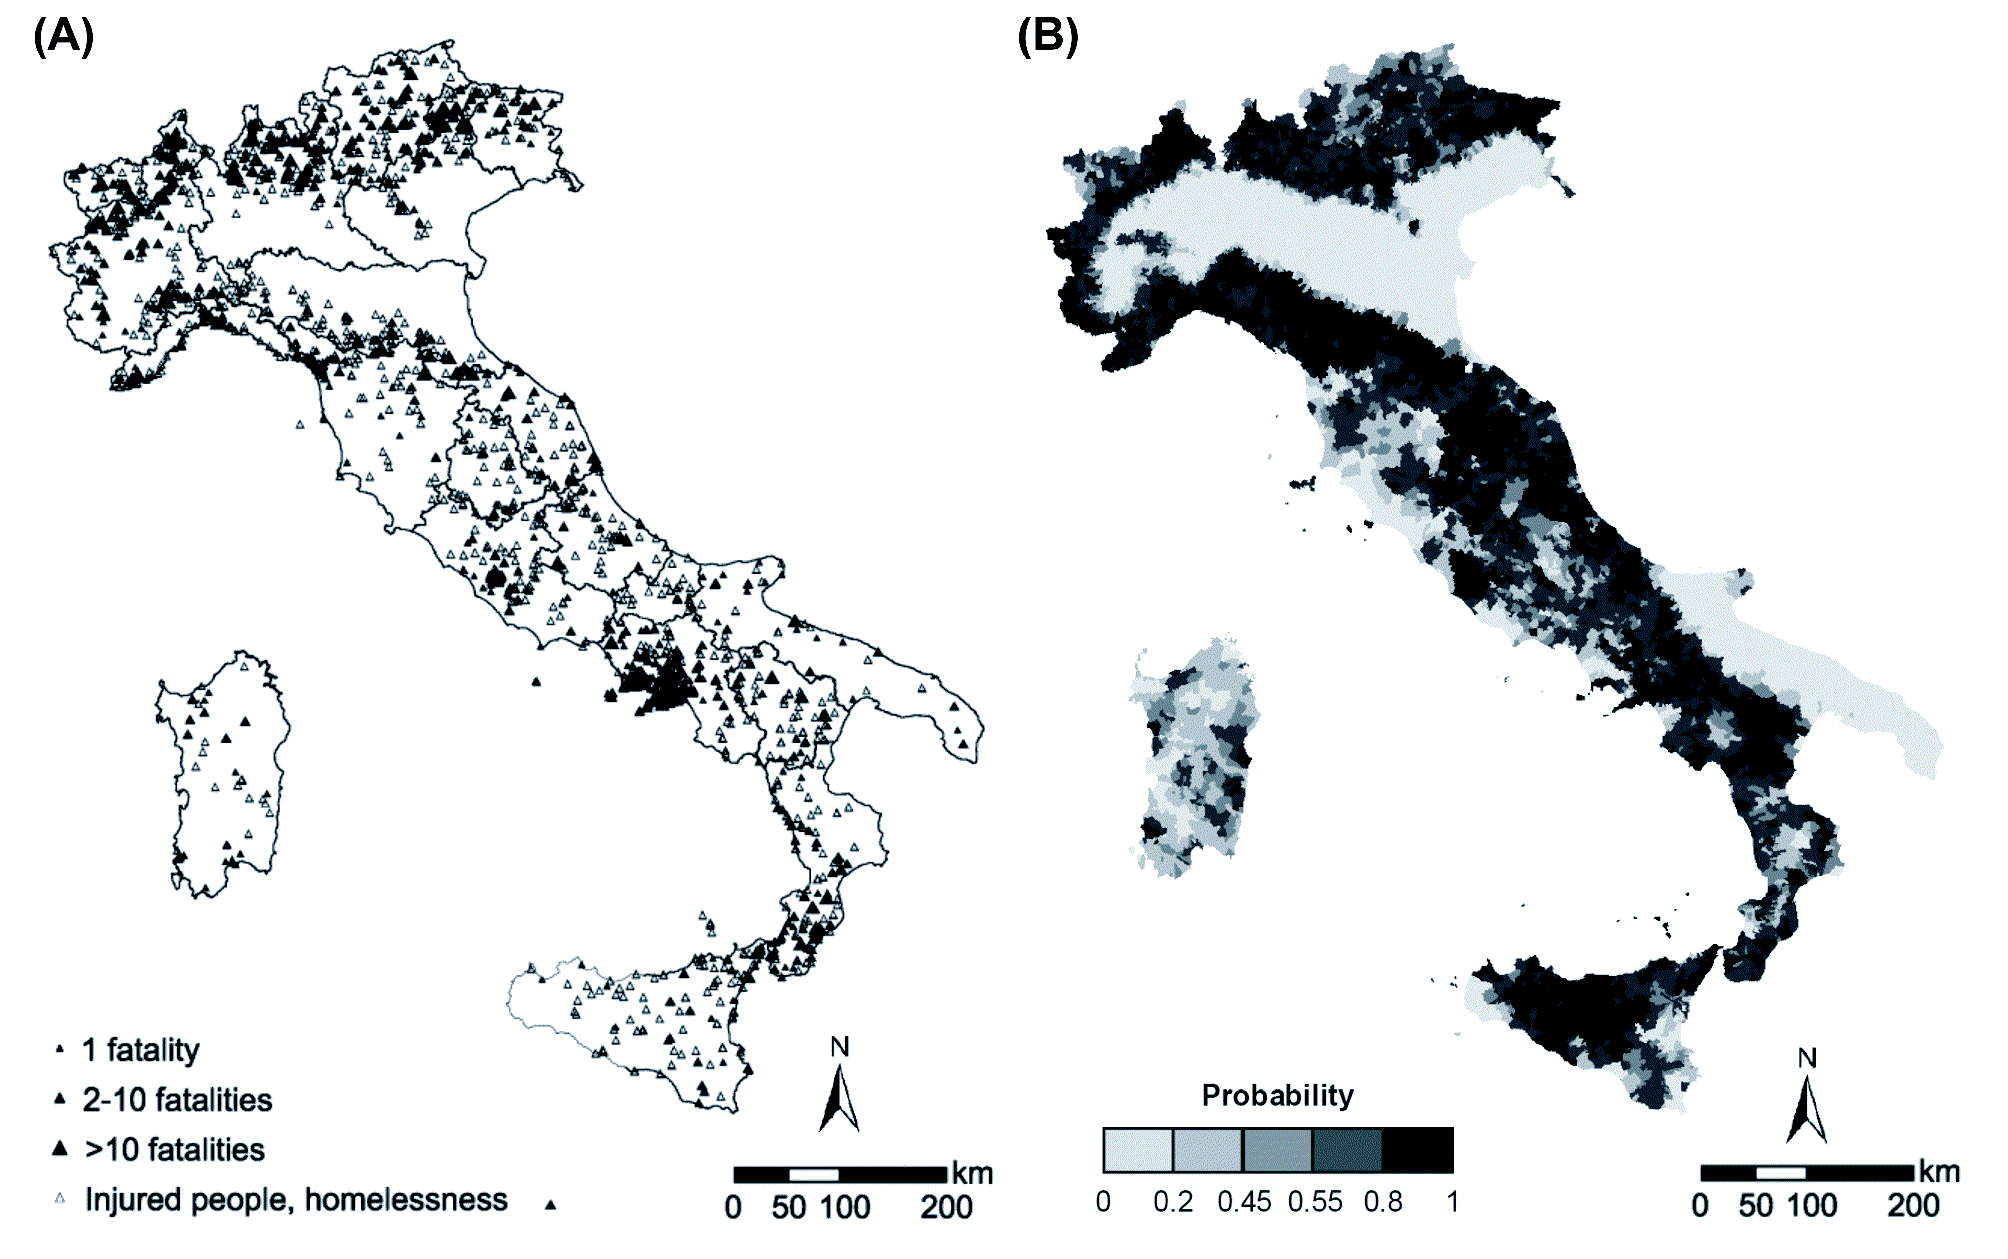
LEFT: Distribution of landslides with human consequences from AD 1300 to 2002. The size of the triangle indicates the intensity of the event. Graphic taken from Guzzetti, F.; Stark, C.P.; Salvati, P., 2005. Evaluation of flood and landslide risk to the population of Italy. Environmental Management 36: 15–36.
Temporal coverage: year 1300 - 2002
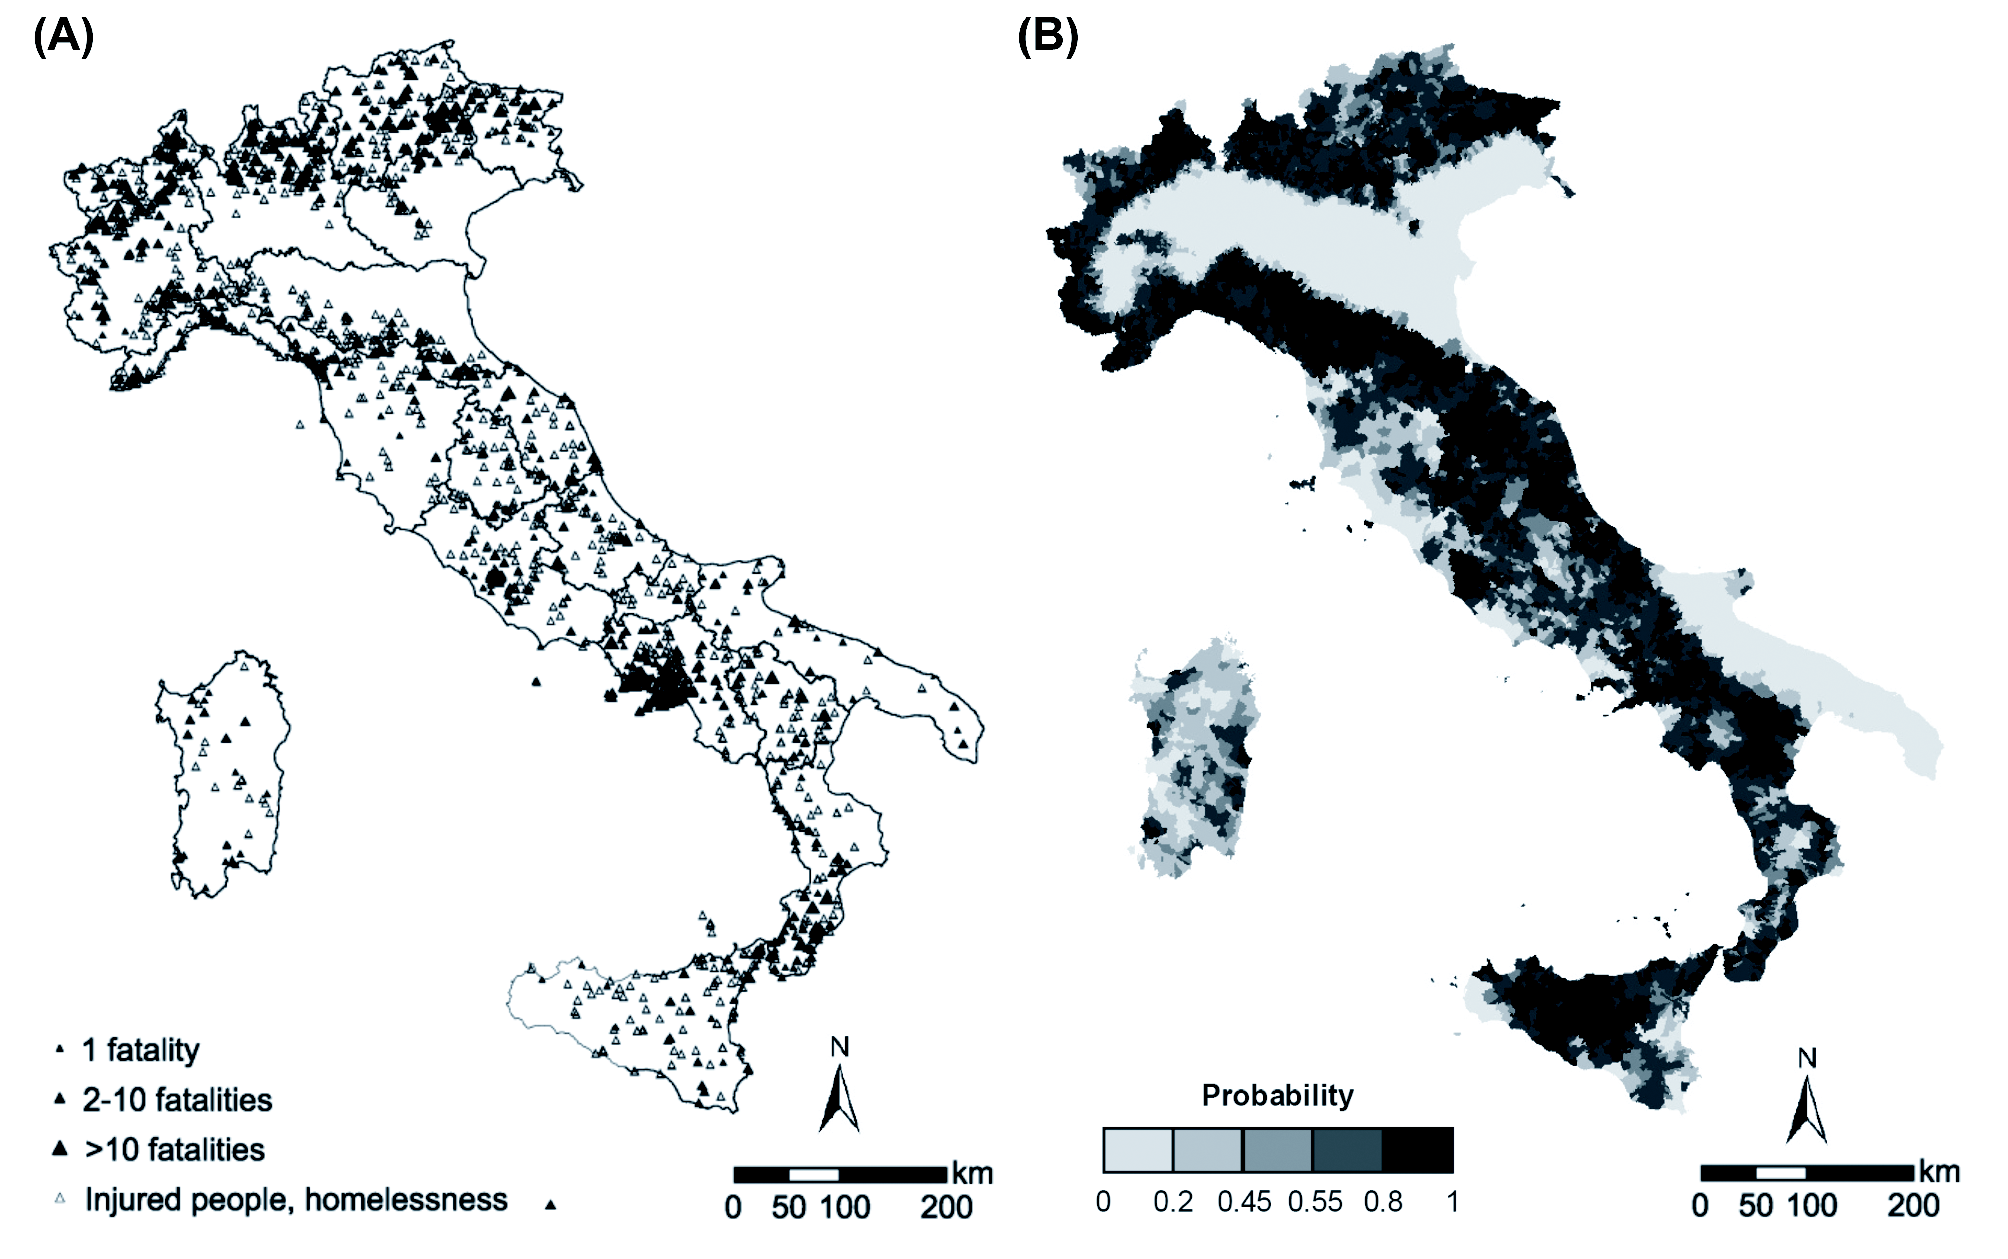
RIGHT: Landslide susceptibility map of Italy. Graphic taken from Günther, A.; Reichenbach, P.; Hervás, J., 2008. Approaches for delineating areas susceptible to landslides in the framework of the European Soil Thematic Strategy. Proceedings of the First World Landslide Forum, Tokyo, 18-21 November 2008, pp. 235-238.
Temporal coverage: year 1990 - 2010

 taken in account for the measurement values(s) of the data resource.")
Document Actions
Share with others