All official European Union website addresses are in the europa.eu domain.
See all EU institutions and bodies
An official website of the European Union | How do you know?
Environmental information systems
EN

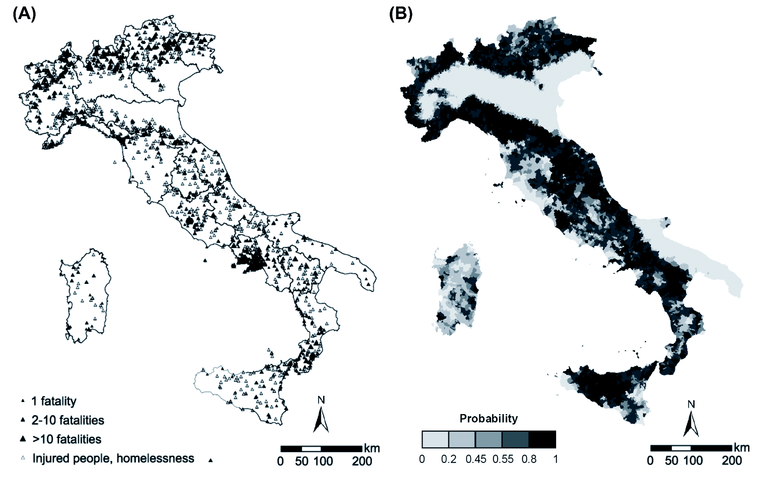
The map shows:
LEFT: Distribution of landslides with human consequences from AD 1300 to 2002. The size of the triangle indicates the intensity of the event.
RIGHT: Landslide susceptibility map of Italy.
Loading