All official European Union website addresses are in the europa.eu domain.
See all EU institutions and bodiesAn official website of the European Union | How do you know?
Environmental information systems
EN
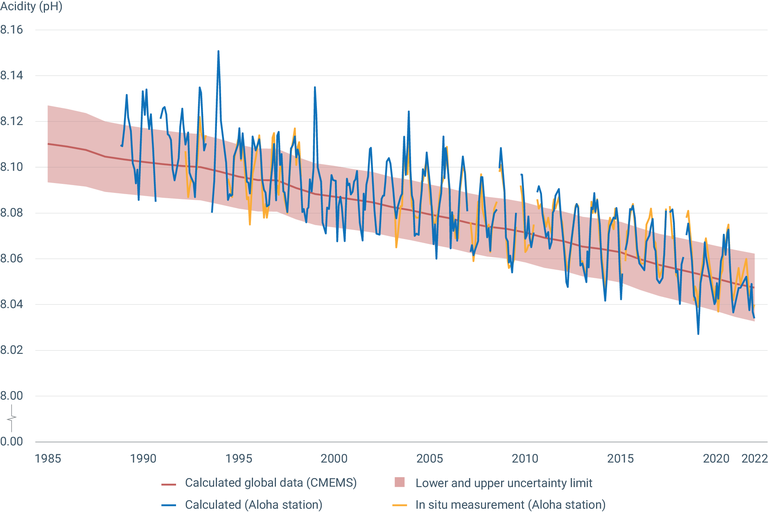
Aloha station: a decline in pH corresponds to an increase in the acidity of ocean water. Changes here are similar to those that are observed over a shorter time frame in Europe. In figure, "In situ measurement (Aloha station)" corresponds to data based on in-situ measurements, while "Calculated (Aloha station)" corresponds to calculated data. Data originate from the Aloha station pH time series (adapted from Dore, J.E., R. Lukas, D.W. Sadler, M.J. Church, and D.M. Karl. 2009. Physical and biogeochemical modulation of ocean acidification in the central North Pacific. Proc Natl Acad Sci USA 106:12235-12240).
CMEMS: global average of surface ocean pH from the Copernicus Marine Service, based on a reconstruction method using in situ data and remote sensing data, as well as empirical relationships. Indicator is available at annual resolution, and from the year 1985 onwards, up to 2022. Error on each yearly value varies, and is added in the data file sheet. Trend and uncertainty are defined as the slope and its residual standard deviation estimated with a linear least-squares regression.
Loading