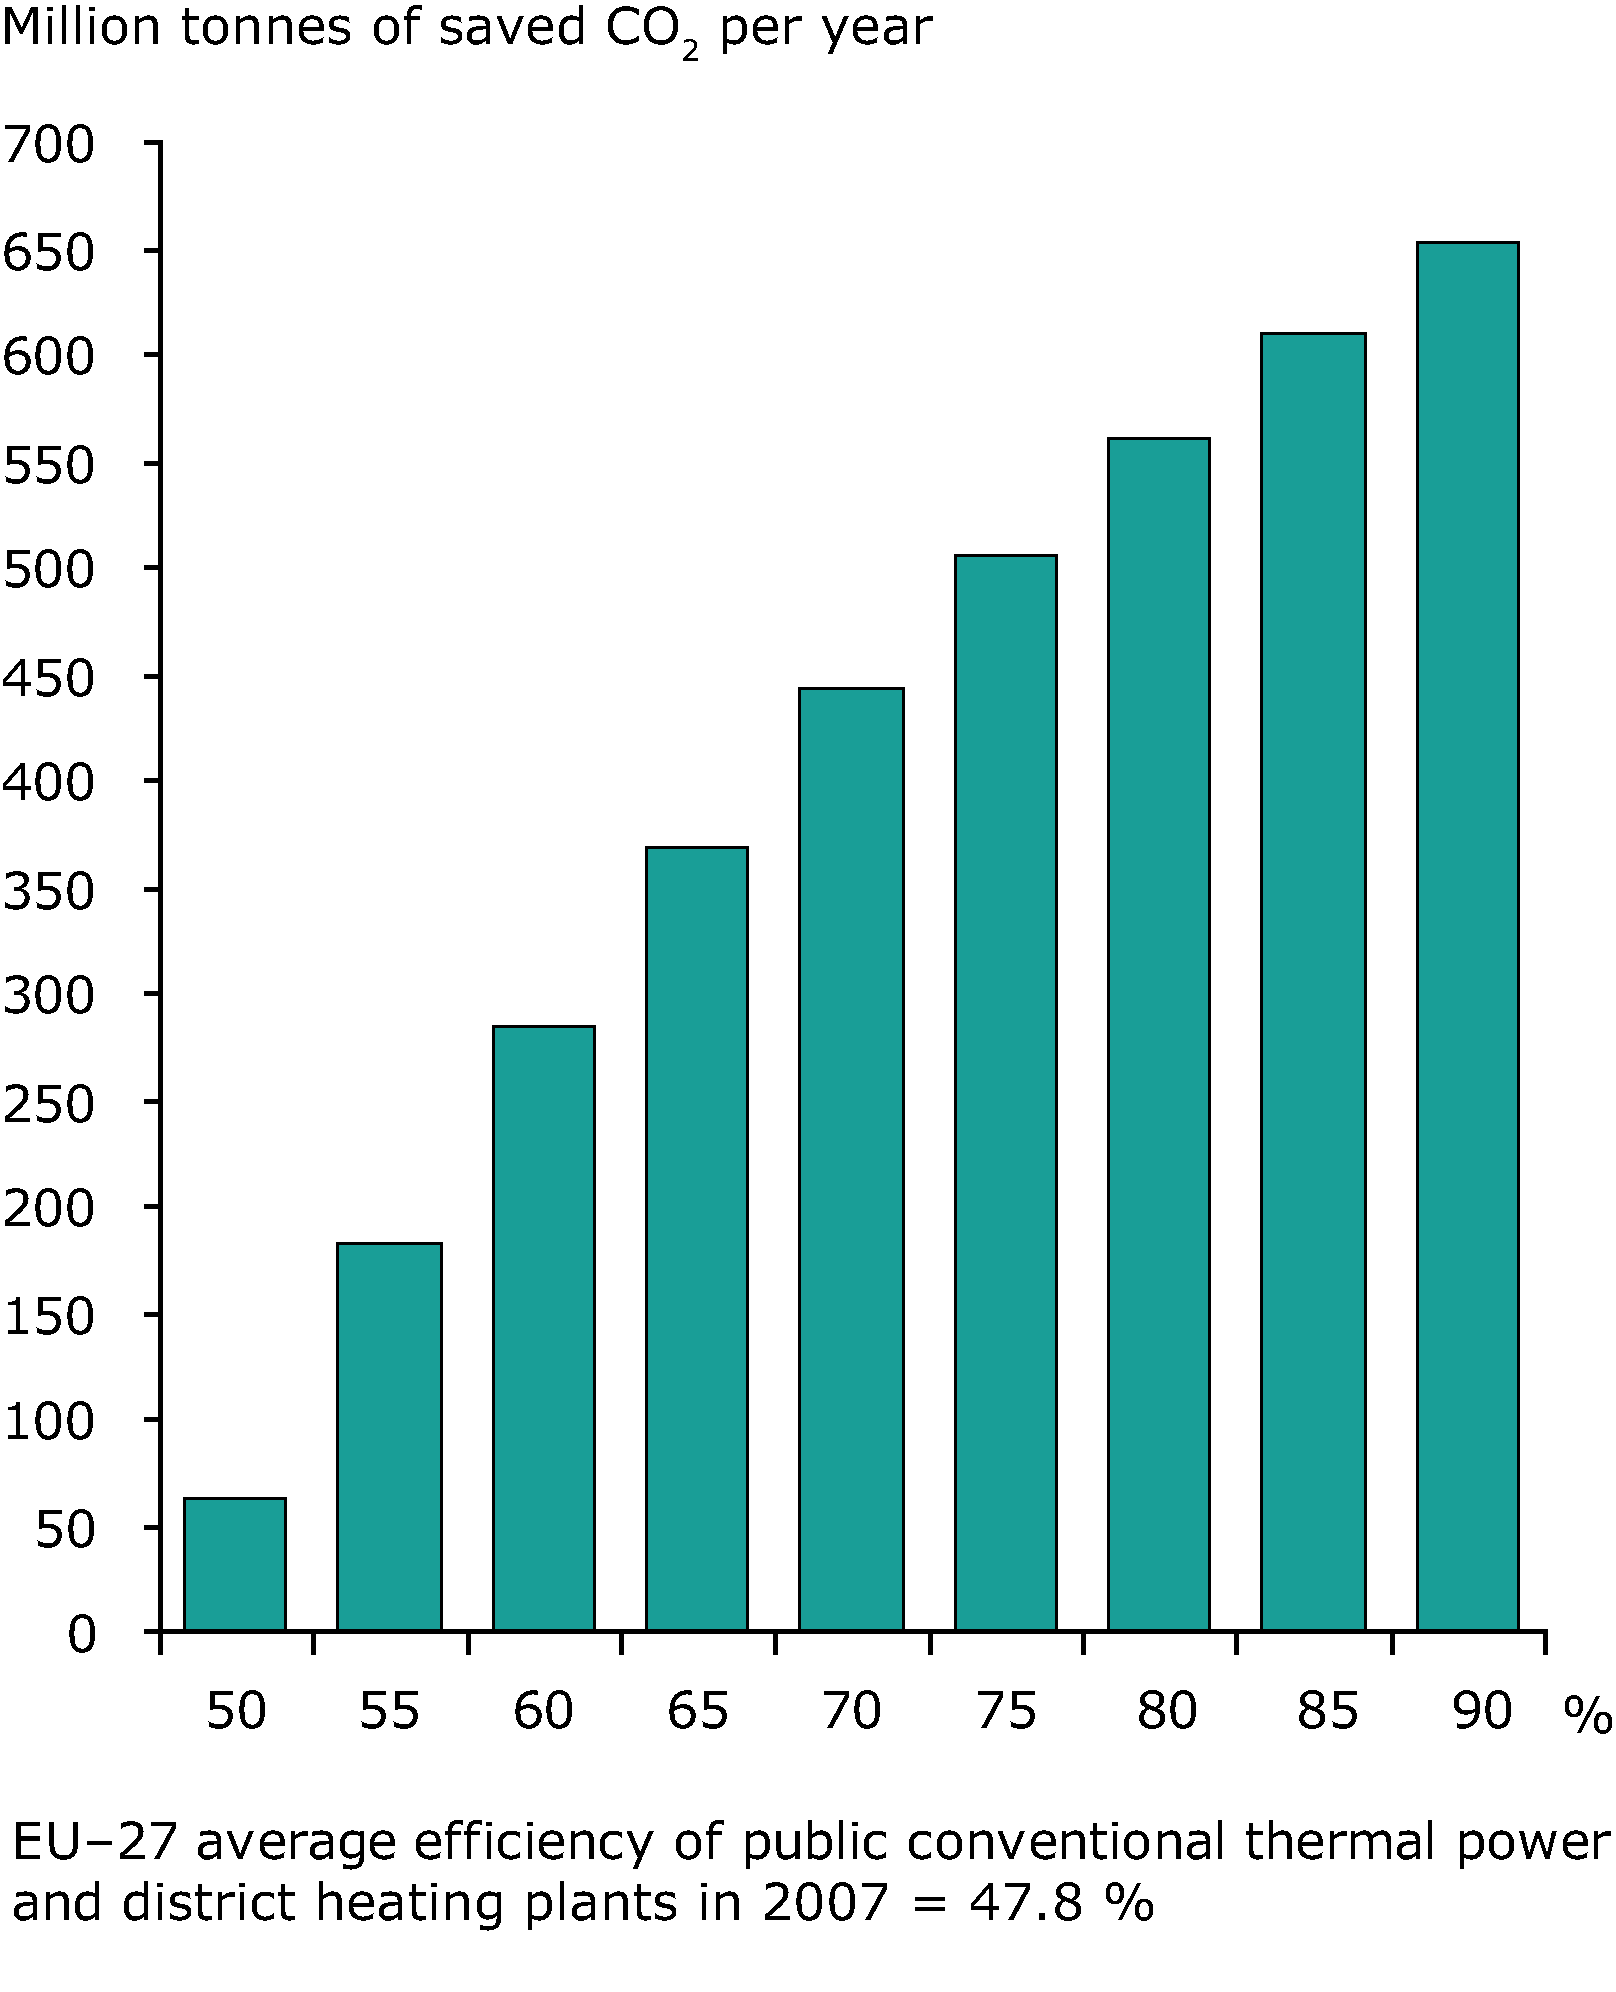
CO2 emissions from ‘public electricity and heat production – CRF 1A1a’ include district heating emissions according to UNFCCC reporting and not just the emissions from public conventional thermal power stations as defined in the energy balances. Also, CO2 emissions should exclude ‘autoproducer’ emissions, which are normally reported in the sector where emissions take place according to the Guidelines. Therefore, the average efficiency shown in the chart above includes main activity producers and district heating and excludes autoproducers.
The CO2 emissions saved per year, for different average efficiencies, is based on the 2007 fuel-mix of the average heat and power plant in EU-27 and assumes that the improvements in energy efficiency do not lead to higher energy consumption.


Document Actions
Share with others