All official European Union website addresses are in the europa.eu domain.
See all EU institutions and bodiesAn official website of the European Union | How do you know?
Environmental information systems
EN
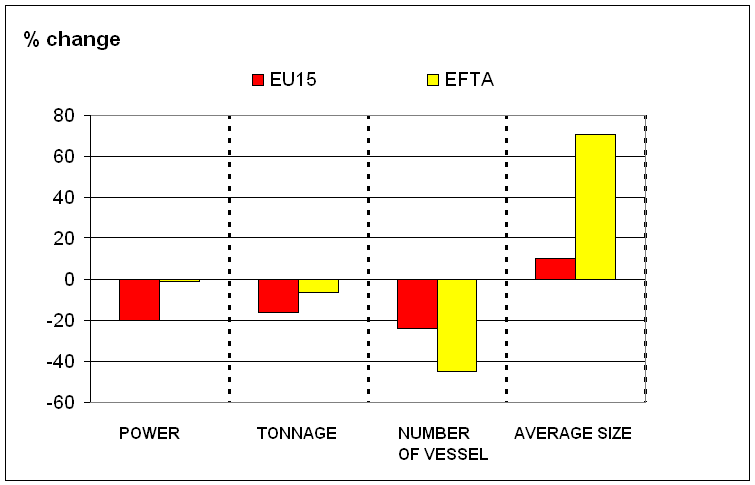
The figure shows changes in fishing fleet capacity and size between 1998 and 2008 in EU15 and EFTA countries. Countries have been grouped into the following categories: EU15 - Belgium, Denmark, Germany, Greece, Spain, France, Ireland, Italy, Luxembourg, Netherlands, Austria, Portugal, Finland, Sweden, United Kingdom; EFTA - Iceland, Norway.
Loading