All official European Union website addresses are in the europa.eu domain.
See all EU institutions and bodies
An official website of the European Union | How do you know?
Environmental information systems
EN

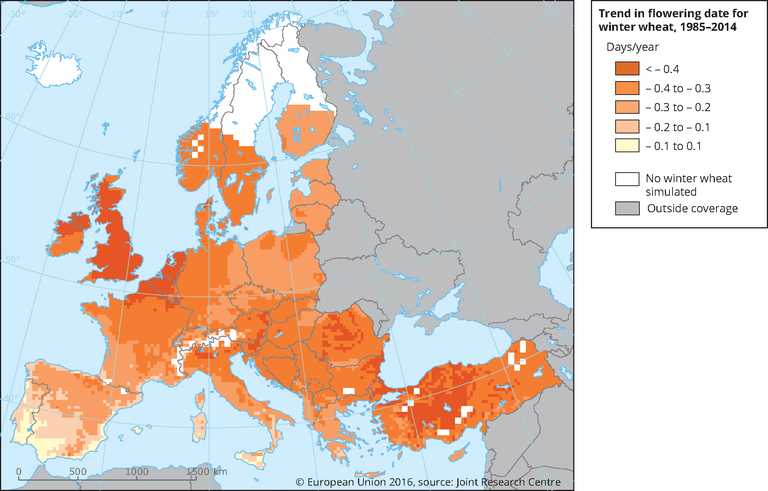
This figure shows the rate of change of the flowering date for winter wheat. The annual rate of change of the flowering date represents the trend coefficient for long-term changes in the occurrence of flowering of winter wheat in Europe. For example, a value -0.6 indicates that in last 30 years the winter wheat flowering date has been anticipated on average by 0.6 days per year (6 days in 10 years). The flowering date is derived from crop growth models simulating crop development of winter wheat as a function of the temperature sum. The simulation is based on the JRC-MARS gridded meteorological data at 25 km resolution.
Loading