All official European Union website addresses are in the europa.eu domain.
See all EU institutions and bodiesAn official website of the European Union | How do you know?
Environmental information systems
EN
- БългарскиBG
- češtinaCS
- HrvatskiHR
- danskDA
- NederlandsNL
- ελληνικάEL
- EnglishEN
- eestiET
- SuomiFI
- FrançaisFR
- DeutschDE
- magyarHU
- ÍslenskaIS
- italianoIT
- LatviešuLV
- lietuviųLT
- MaltiMT
- NorskNO
- polskiPL
- PortuguêsPT
- RomânăRO
- slovenčinaSK
- SlovenščinaSL
- EspañolES
- SvenskaSV
- TürkçeTR
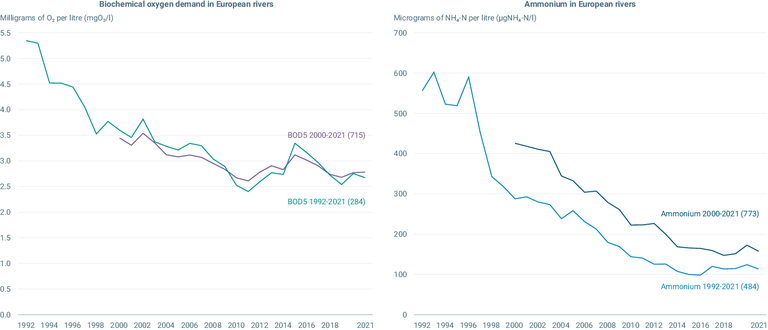
Biochemical oxygen demand and ammonium in European Rivers
Chart (static)
This figure shows the trends in biochemical oxygen demand (BOD) and ammonium in European rivers.
Downloads
Data sources
Metadata
More info
Loading
- Waterbase - Water Quality ICM, 2022
Albania, Austria, Belgium, Bulgaria, Croatia, Cyprus, Czechia, Estonia, Finland, Germany, Iceland, Ireland, Italy, Latvia, Lithuania, North Macedonia, Norway, Poland, Romania, Serbia, Slovakia, Slovenia, Spain, Sweden
1992-2021
Methodology
The data series are calculated as the average of annual mean concentrations for river sites in Europe. Only complete time series after inter/extrapolation are included (see indicator's "Methodology" section).
Left chart:
BOD7 data has been recalculated into BOD5 data.
Additional information
Two time series are shown – a longer time series representing fewer water bodies and a shorter time series representing more water bodies.
Left chart:
Biochemical oxygen demand (BOD) in rivers: The number of river monitoring sites included per country is given in parenthesis:
1992-2021: Albania (4), Austria (1), Belgium (26), Bulgaria (56), Czechia (22), Estonia (33), Finland (5), Ireland (3), Latvia (13), Lithuania (22), North Macedonia (4), Slovakia (8), Slovenia (8), Spain (78), Sweden (1).
2000-2021: Albania (5), Austria (1), Belgium (36), Bulgaria (73), Croatia (23), Cyprus (4), Czechia (22), Estonia (35), Finland (5), Ireland (14), Italy (44), Latvia (16), Lithuania (22), North Macedonia (8), Poland (90), Romania (88), Serbia (33), Slovakia (8), Slovenia (10), Spain (177), Sweden (1).
Right chart:
Ammonium in rivers: The number of reported river monitoring sites per country is given in parenthesis:
1992-2021: Albania (4), Austria (1), Belgium (20), Bulgaria (38), Estonia (35), Finland (59), Germany (119), Ireland (4), Latvia (12), Lithuania (22), North Macedonia (5), Norway (26), Slovenia (7), Spain (22), Sweden (110).
2000-2021: Albania (8), Austria (1), Belgium (23), Bulgaria (56), Croatia (23), Estonia (37), Finland (68), Germany (122), Iceland (1), Ireland (28), Italy (25), Latvia (15), Lithuania (22), North Macedonia (17), Norway (26), Poland (4), Romania (89), Serbia (33), Slovenia (8), Spain (55), Sweden (112).