|
Indicator
|
EU indicator past trend
|
Selected objective to be met by 2020
|
Indicative outlook of the EU meeting the selected objective by 2020
|
|
Total greenhouse gas emission trends and projections
|

|
Reduce greenhouse gas emissions by 20% compared with 1990 levels - 2020 Climate and Energy Package
|

|
|
The decreasing trend of greenhouse gases and the future evolution as projected by the EU Member States indicate that the 2020 greenhouse gas emissions reduction target will be met
|
For further information on the scoreboard methodology please see Box I.1 in the EEA Environmental indicator report 2016
Setting the scene
The 7th EAP includes the objective for the EU to meet its 2020 climate and energy targets and to work towards reducing greenhouse gas emissions by 80 – 95 % by 2050, compared with 1990 levels (EU, 2013). Greenhouse gas emissions are the primary cause of climate change. Climate change will further aggravate environmental problems by causing prolonged droughts and heatwaves, floods, storms, forest fires, and soil and coastal erosion, as well as new or more virulent forms of human, animal or plant disease. Climate change is also expected to significantly increase the pressure on Europe’s water resources.
Policy targets and progress
The EU has committed to achieving a reduction in its greenhouse gas emissions of at least 20 % by 2020, compared with 1990 levels (EEA, 2016a). This objective is embodied in both European and international commitments and targets, which clearly align with the objectives of the 7th EAP described above.
The overall emissions reduction target is separated into one EU-wide target for large industrial installations, covered by the European Union Emissions Trading System (EU ETS) and 28 binding national targets for all the emissions that are not in the EU ETS. These national targets, set under the Effort Sharing Decision (ESD), cover sectors such as households, buildings, transport, agriculture, services, waste and smaller industrial installations. The EU ETS is expected to deliver a 21 % reduction in its emissions, and the non-ETS sectors should reduce emissions by 9 % by 2020 (both compared with 2005 levels). Together, these will lead to a reduction of 20 % in overall greenhouse gas emissions by 2020 compared with 1990 levels.
Within the ETS system, the EU sets limits on emissions from high-emitting industry sectors. With these limits as a reference, companies can buy and sell emission allowances as needed. This ‘cap-and-trade’ approach gives companies the flexibility they need to cut their emissions in the most cost-effective way. The EU ETS covers more than 11 000 power stations and manufacturing plants in the 28 EU Member States, as well as in Iceland, Liechtenstein and Norway. Emissions from commercial aircraft flying within and between most of these countries are also covered. In 2014, EU ETS emissions represented around 42 % of total EU greenhouse gas emissions.

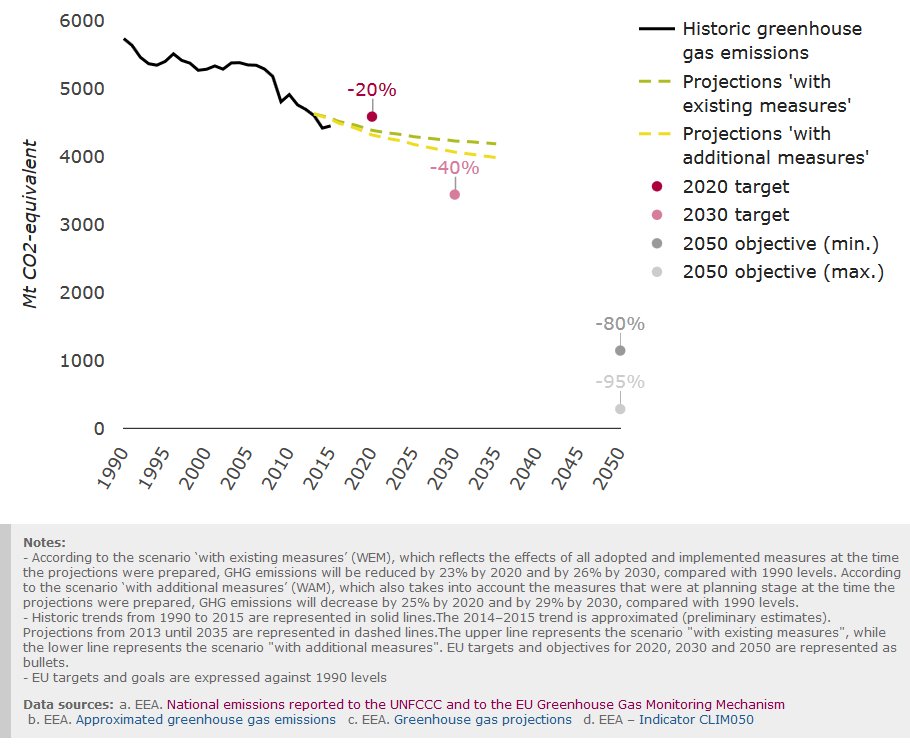
In 2015, EU greenhouse gas emissions were already 22 % below 1990 levels (see Figure 1). Preliminary greenhouse emission estimates indicate an expected 0.7 % increase for 2015 (EEA, 2016b). This follows an exceptional 4.0 % reduction the previous year, which was due to a particularly warm winter. Emissions from industries in the EU Emissions Trading System (ETS) continued to decrease in 2015. On the other hand, emissions not included in the ETS increased. In particular, transport emissions increased for the second year in a row.
The EU has improved its energy intensity over time. This has been because of energy efficiency improvements, structural changes in the economy and reduced energy consumption as a result of the 2008 economic downturn (for more information, see the Energy efficiency briefing (AIRS_PO2.7, 2016)1). This trend is primarily responsible for the reductions in greenhouse gas emissions observed in the EU between 2005 and 2013 (EEA, 2014). Reductions in greenhouse gas emissions can also be attributed to a change in the mix of fossil fuels used and the increasing use of carbon-free energy sources, including renewable energy sources (RES) (for more information, see the Renewable energies briefing (AIRS_PO2.9, 2016)2), reflecting the effects of policies and measures supporting the deployment of RES (e.g. feed-in tariffs), the establishment of a carbon price through the EU ETS, and external factors such as fluctuations in fossil fuel prices (EEA, 2015a). The strong growth in the use of RES — particularly wind, solar and biomass — and the resulting increased proportion of RES in electricity production have also contributed to the reduction in emissions. Demand for energy to heat households was also lower during this period, as Europe has experienced milder winters on average since 1990 (EEA, 2015a, 2016b and 2016c).
As projected by the EU Member States, emissions are expected to decrease further to 23% by 2020 with the current measures that are already in place. Additional measures (currently planned by Member States) could further reduce emissions to almost 25 % below 1990 levels. Most of the savings in greenhouse gas emissions are expected to take place as a result of the EU ETS (EEA, 2015a).
Country level information
To meet the 2020 GHG target, the EU adopted a climate and energy package in 2009, comprising a legislative set of binding targets, which defined a single target for all EU emissions covered by the EU Emissions Trading System (ETS) and a set of national targets for all other emissions not covered by the EU ETS. Since 2005, which was the first year of operation of the EU ETS, the ETS sectors have seen reductions in emissions of approximately 24 %. The main sectors that experienced particularly large decreases in emissions were cement clinker and lime. Reductions in emissions from combustion installations, which represent more than 70 % of all ETS emissions and are dominated by electricity generation, are largely as a result of changes to the mixture of fuels used to produce heat and electricity. The use of hard coal and lignite fuels in electricity generation has declined since 2005 and electricity generation from renewable sources has increased considerably. The reduction in emissions may also have been enhanced as a result of improvements in transformation efficiency for electricity generation, which means that less primary energy was necessary to generate a constant quantity of electricity. The cement, lime and iron and steel sectors follow similar trends, with emissions increasing up to 2007 and then decreasing. These reductions in emissions were, to a large extent, driven by reduced production as a result of the economic downturn.
In contrast to the sectors in the EU ETS, which are regulated at EU level, it is the responsibility of EU Member States to define and implement national policies and measures to limit emissions from the sectors covered by the ESD, the residential and commercial, transport, agriculture, waste and smaller industrial installation sectors. In 2014, greenhouse gas emissions from the ESD sectors represented approximately 58 % of total EU greenhouse gas emissions.

The national emissions targets for 2020 range from a 20 % reduction in emissions (compared with 2005 levels) to a 20 % increase. Less wealthy countries are allowed emission increases in the ESD sectors, because their relatively higher economic growth is likely to be accompanied by higher emissions. Nevertheless, their targets represent a limit on their emissions compared with the emissions projected using business-as-usual growth rates. All Member States are therefore required to make an effort to reduce emissions (EC, 2015).
Examples of potential policies and measures that could be implemented to reduce emissions include reducing transport demand, promoting public transport, a shift away from transport based on fossil fuels, support schemes for the retrofitting of building stock, more efficient heating and cooling systems, renewable energy for heating and cooling, more climate-friendly farming practices and the conversion of livestock manure to biogas (EC, 2015).
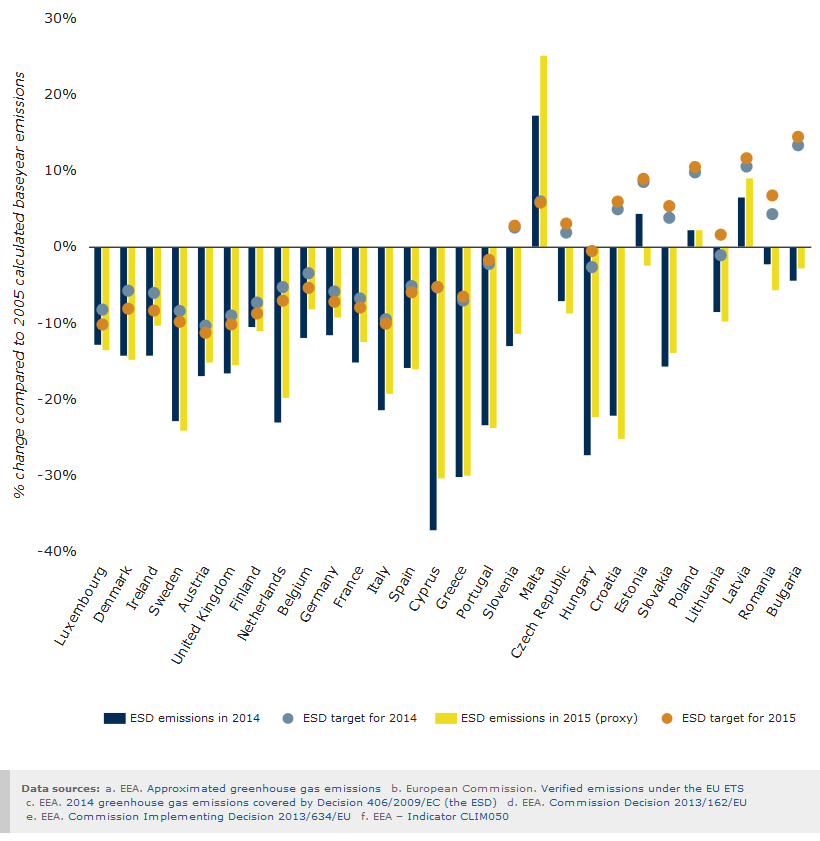
The assessment of current progress towards the ESD targets compares the non-ETS emissions for each year with the annual national targets. In 2014, all Member States but one (Malta) were below their national ESD targets. The 2015 proxy data seem to confirm this trend across the EU (Figure 2).
National projections show that, in most Member States, ESD emissions will remain below annual ESD targets until 2020. However, in five Member States (Austria, Belgium, Denmark, Ireland and Luxembourg) emissions in 2020 could exceed targets if no additional measures are implemented.
Outlook beyond 2020
The EU has also adopted a long-term goal for 2050 of reducing Europe’s greenhouse gas emissions by 80 – 95 % compared with 1990 levels. To ensure that the EU is on a cost-effective track towards meeting this objective, in 2014 the European Council adopted a new set of climate and energy targets for 2030 (EC, 2014). This includes a binding target of reducing emissions by at least 40 % compared with 1990 levels.
Looking towards 2030, projections from Member States show that both the current measures in place and the additional national measures that were in the planning stage at the time when projections were made will not be able to deliver sufficient savings to enable the EU to achieve the reduction target of 40 % below 1990 levels (Figure 1). The pace of greenhouse gas emission reductions is projected to slow down after 2020, despite the fact that mid- and long-term targets will require more rapid reductions. Existing policies and measures are expected to result in a reduction in emissions of 26 % by 2030, compared with 1990 levels, and the implementation of additional measures could increase this reduction to 29 %.
Because of this projected shortfall, new policies and measures are currently being developed at EU level to further reduce greenhouse gas emissions. These policy options include measures applicable to the transport and land use sectors, as well as the reform of the ETS, which includes a more stringent cap to achieve reductions beyond 2020, as well as a post-2020 ESD and measures to enhance energy efficiency based on the 2030 framework for climate and energy policies.
About the indicator
The indicator presents past and future trends for anthropogenic greenhouse gas emissions in Europe. In line with the United Nations Framework Convention on Climate Change (UNFCCC) and IPCC reporting guidelines, the indicator covers the following greenhouse gases: carbon dioxide (CO2), methane (CH4), nitrous oxide (N2O), hydrofluorocarbons (HFCs), perfluorocarbons (PFCs), sulphur hexafluoride (SF6) and nitrogen trifluoride (NF3). These are weighted by their global warming potential, aggregated and presented in CO2-equivalent units. The list of gases does not include the greenhouse gases that are ozone-depleting substances and are controlled by the Montreal Protocol. The indicator covers emissions from international aviation and excludes emissions or removals from land use, land use change and forestry (LULUCF) and international shipping. For the past, the indicator uses the greenhouse gas inventory and ETS data. It also uses projection data reported by EU Member States in two scenarios: a ‘with existing measures’ (WEM) scenario and a ‘with additional measures’ (WAM) scenario. The WAM scenario takes into account measures planned but not yet adopted. However, not all EU Member States reported a WAM scenario, so the predicted reduction might not take all planned measures into account and therefore may be an underestimate.
Document Actions
Share with others