According to the report, despite a reduction in emissions in 2020, concentrations of particulate matter, (including both PM2.5 and PM10), ozone (O3), and nitrogen dioxide (NO2) regularly exceed the European Union (EU) Air Quality Standards and they are well above the latest World Health Organization (WHO) recommendations.
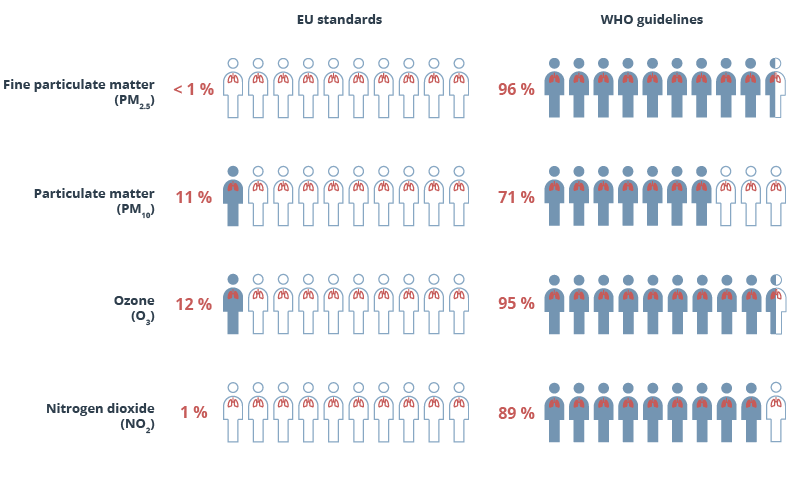
Figure 1 presents the percentage of the EU urban population exposed to air pollutants concentrations above EU standards as set out in the ambient air quality directives and the WHO global air quality guidelines. The EU air quality standards are less strict for all pollutants than the WHO air quality guidelines.
PM2.5
PM2.5 can travel deeply into the human respiratory system, reaching the lungs. Exposure to PM2.5 is linked to respiratory and cardiovascular diseases and reduced lung function. 96% of the urban population was exposed to concentrations of fine particulate matter (PM2.5) above the WHO annual guideline of 5 µg/m3.
Figure 2 presents annual average concentrations of PM2.5 measured at urban monitoring stations located in European cities in 2020 and in 2021. The highest levels of PM2.5 concentrations were measured in cities in Italy, Poland, Bulgaria, Croatia, and the Czech Republic.
Note: The maps present annual average PM2.5 concentrations measured at urban air quality monitoring stations, including background, industrial and traffic stations.
PM10
PM10 includes particulate matter with a diameter of 10 µm or less. Exposure to particles can adversely affect both human lungs and heart and leads to premature death in people with heart or lung disease. In 2020, 71% of the urban population was exposed to concentrations of PM10 above the WHO guideline of 45 µg/m3.
Figure 3 presents the 90.4 percentile of average daily concentrations of PM10 measured at urban monitoring stations located in European cities in 2020 and in 2021. Exceedances of the EU daily limit value for PM10 are seen at urban locations in Italy, Poland, Croatia, Bulgaria, and south-eastern countries (Figure 3).
Note: The maps present the 90.4 percentile of daily PM10 concentrations measured at urban air quality monitoring stations, including background, industrial and traffic stations. The 90.4 percentile refers to the EU daily limit value for PM10.
O3
Exposure to high ozone concentrations can cause serious harm to the respiratory system and leads to cardiovascular diseases and puts sensitive receptors at a higher risk of premature death. 95% of the urban population was exposed to concentrations of O3 above the WHO guideline of 100 µg/m3.
Figure 4 presents the 93.2 percentile of maximum daily 8-hour mean concentrations of O3 measured at urban monitoring stations located in European cities in 2020 and in 2021. Exceedances of the EU target value for O3 were widely reported throughout Europe.
Note: The maps present the 93.2 percentile of maximum O3 daily 8-hour mean concentrations measured at urban air quality monitoring stations, including background, industrial and traffic stations. The 93.2 percentile refers to the EU target value for O3.
NO2
Elevated levels of NO2 are associated with adverse effects to the human respiratory system and a long-term exposure to high levels of NO2 can cause chronic lung disease. 89% of the urban population was exposed to concentrations of NO2 above the WHO guideline of 10 µg/m3.
Figure 5 presents the annual average concentrations of NO2 measured at urban monitoring stations located in European cities in 2020 and in 2021. The highest NO2 concentrations were recorded in big cities across Europe.
Note: The maps present annual average concentrations of NO2 measured at urban air quality monitoring stations, including background, industrial and traffic stations.
Source: Europe’s air quality status 2022 — European Environment Agency (europa.eu) and AIR003

Document Actions
Share with others