All official European Union website addresses are in the europa.eu domain.
See all EU institutions and bodiesDo something for our planet, print this page only if needed. Even a small action can make an enormous difference when millions of people do it!
Air quality in Europe has improved over recent decades. Nevertheless, air pollution remains the number one environmental health risk in Europe. Current regulatory monitoring networks provide valuable information for assessing the health effects of air pollution, complemented by air quality modelling, satellite observations and more. Further complementary tools can help us expand our knowledge on air pollution and its impacts, including improved air quality modelling and further use of satellite data, low-cost sensors and citizen science.
Over recent years, air quality monitoring technologies have undergone significant changes. One key advance has been the development of low-cost sensor devices (ETC/ACM, 2018). Available in comparatively large quantities to both the public and professionals, these devices offer new opportunities to support established air quality monitoring networks.
One successful example of citizen scientists (EEA, 2019) measuring and informing local policy processes is the CurieuzenAir project. With the help of thousands of citizens equipped with low-cost sampling kits, the project mapped nitrogen dioxide (NO2) concentrations at 3,000 sampling sites in Brussels. This significantly increased measurement coverage from the coverage provided by the relatively few official monitoring stations. The project showed air quality variations in greater detail while using the official ‘reference’ station data in parallel. As a result, it simultaneously identified air pollution hot spots and areas with good air quality — and revealed inequalities of exposure (wealthier neighbourhoods had better quality air). By engaging citizens directly, the project increased awareness among participants — not only with respect to air quality, but also regarding their own behaviour (for example, around transport). Additionally, the precise information enabled local authorities to act in a more targeted manner. For more detail on the project outcomes, see the project report (Lauriks et al., 2022).
While CurieuzenAir demonstrates how new technologies and approaches involving citizens can contribute to obtaining useful data and increase awareness, low-cost devices in particular have their limitations. They are not as reliable or accurate as official monitoring stations and can be affected by other factors, such as weather and the presence of other pollutants. However, ongoing technological developments — including the improvement of low-cost devices and new ways to process big data — can help address these challenges in the future.
EEA, 2019, Assessing air quality through citizen science, EEA Report No 19/2019, European Environment Agency (https://www.eea.europa.eu/publications/assessing-air-quality-through-citizen-science) accessed 18 October 2022.
ETC/ACM, 2018, Low cost sensor systems for air quality assessment: possibilities and challenges,ETC/ACM Report No 2018/21 (https://www.eionet.europa.eu/etcs/etc-atni/products/etc-atni-reports/etc-acm-report-no-2018-21-low-cost-sensor-systems-for-air-quality-assessment-possibilities-and-challenges) accessed 18 October 2022.
Lauriks, F., et al., 2022, CurieuzenAir: data collection, data analysis and results, University of Antwerp (https://curieuzenair.brussels/wp-content/uploads/2022/03/CurieuzenAir_AirQualityInBrussels-Report-Final-Version.pdf) accessed 18 October 2022.
In Europe, we spend much of our lives indoors. Poor indoor air quality can significantly impact our health and well-being and is associated with eye, nose and throat irritation, headaches, respiratory diseases, heart disease and cancer. Many sources can adversely affect indoor air quality, including building products and furnishings that release chemical substances (e.g. formaldehyde and other volatile organic compounds (VOC), flame retardants, and per- and polyfluoroalkyl substances (PFAS)). Older construction materials and products with longer lifecycles may contain hazardous chemicals that are now banned, such as legacy flame retardants and polychlorinated biphenyls (PCBs) (EEA, 2020). Outdoor air pollution also contributes to indoor air pollution. Lifestyle habits such as smoking or burning candles also reduce indoor air quality. People themselves affect indoor air quality by exhaling carbon dioxide (CO2). Moreover, air quality can further be compromised by the building quality itself. Notably, homes with low socio-economic status exhibit worse indoor air quality (Ferguson et al., 2020).
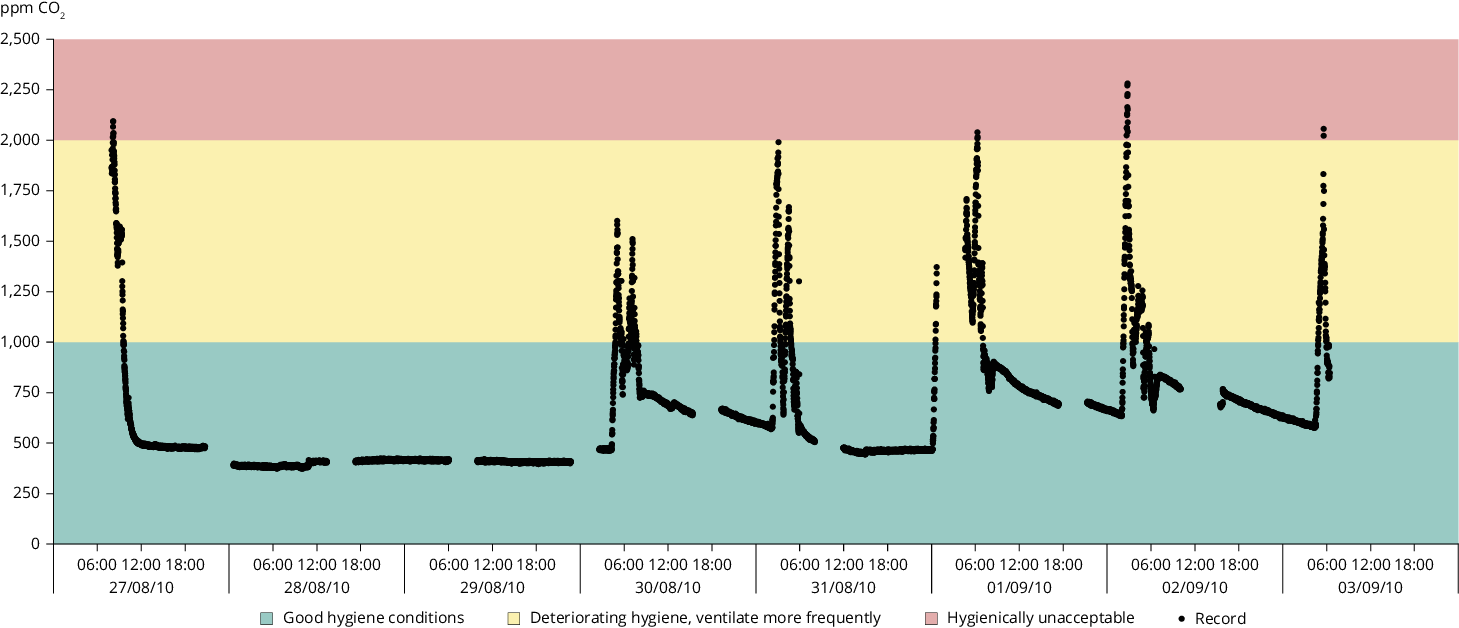
Because people exhale CO2, its concentration in the air serves as an indicator of indoor air quality, and this increases over time in rooms where people sit together and do not have good ventilation.
The Sinphonie (Schools Indoor Pollution and Health: Observatory Network in Europe) project investigated children’s exposure to various indoor air pollutants in schools across Europe (Csobod et al., 2014). The results revealed that CO2 concentrations in classrooms were above the recommended guidelines for half of all children and teachers. Higher concentrations correlated with poor ventilation. Figure 1 shows a typical pattern of CO2 concentration in one school classroom over a week during the summer.
Source: These data were provided to the EEA by Umweltbundesamt (UBA - German Environment Agency) based on a measurement campaign in schools in 2010. Further information on the measurement campaign can be found in Giacomini et al. (2011).
Click here to view the figure enlarged
Click here for different chart formats and data
CO2 traffic lights are simple measuring devices that assess ventilation status in an indoor space. The following are recommendations for CO2 concentrations in indoor air:
Good indoor air quality can be achieved by using low-emission building products, furniture, furnishings and cleaning products. In addition, ongoing efforts to eliminate hazardous chemicals from products under the chemicals strategy for sustainability will support improvements in indoor air quality. Regarding individual behaviours, information campaigns that inform the general public about the activities that reduce indoor air quality — such as cooking with gas stoves, smoking and burning candles — may spark change.
Lastly, regular and sufficient ventilation is also essential. The exchange of air ensures that used air (containing CO2 and odour), chemical vapours from furniture and building products and humidity are transported outside.
Csobod, E., et al., 2014, SINPHONIE — Schools Indoor Pollution and Health Observatory Network in Europe — final report, Publications Office of the European Union, Luxembourg (https://publications.jrc.ec.europa.eu/repository/handle/JRC91160) accessed 18 October 2022.
EEA, 2020, Healthy environment, healthy lives: how the environment influences health and well-being in Europe, European Environment Agency (https://www.eea.europa.eu/publications/healthy-environment-healthy-lives) accessed 18 October 2022.
Ferguson, L., et al., 2020, ‘Exposure to indoor air pollution across socio-economic groups in high-income countries: a scoping review of the literature and a modelling methodology’, Environment International 143, 105748 (https://doi.org/10.1016/j.envint.2020.105748).
Giacomini, M.T., et al., 2011, ‘German guidelines for schools - was it enough to create a healthy environment?’, Paper ID a449, in Proceedings of Indoor Air 2011, Austin, TX, USA (https://www.isiaq.org/docs/TOC_Final.pdf) accessed 6 November 2022.
Asbestos is a highly dangerous carcinogenic agent. It is a mineral with fibres that has excellent insulating properties; hence, before its serious health risks were discovered, asbestos was commonly used in insulation and fireproofing in ships, train carriages, military vehicles and homes, among other places. Asbestos is still present in many older buildings and homes, but it is often hidden behind walls and floor tiles or in the filling material around windows and its presence in public and private buildings is often overlooked. If buildings are refurbished, any materials containing asbestos must be carefully removed.
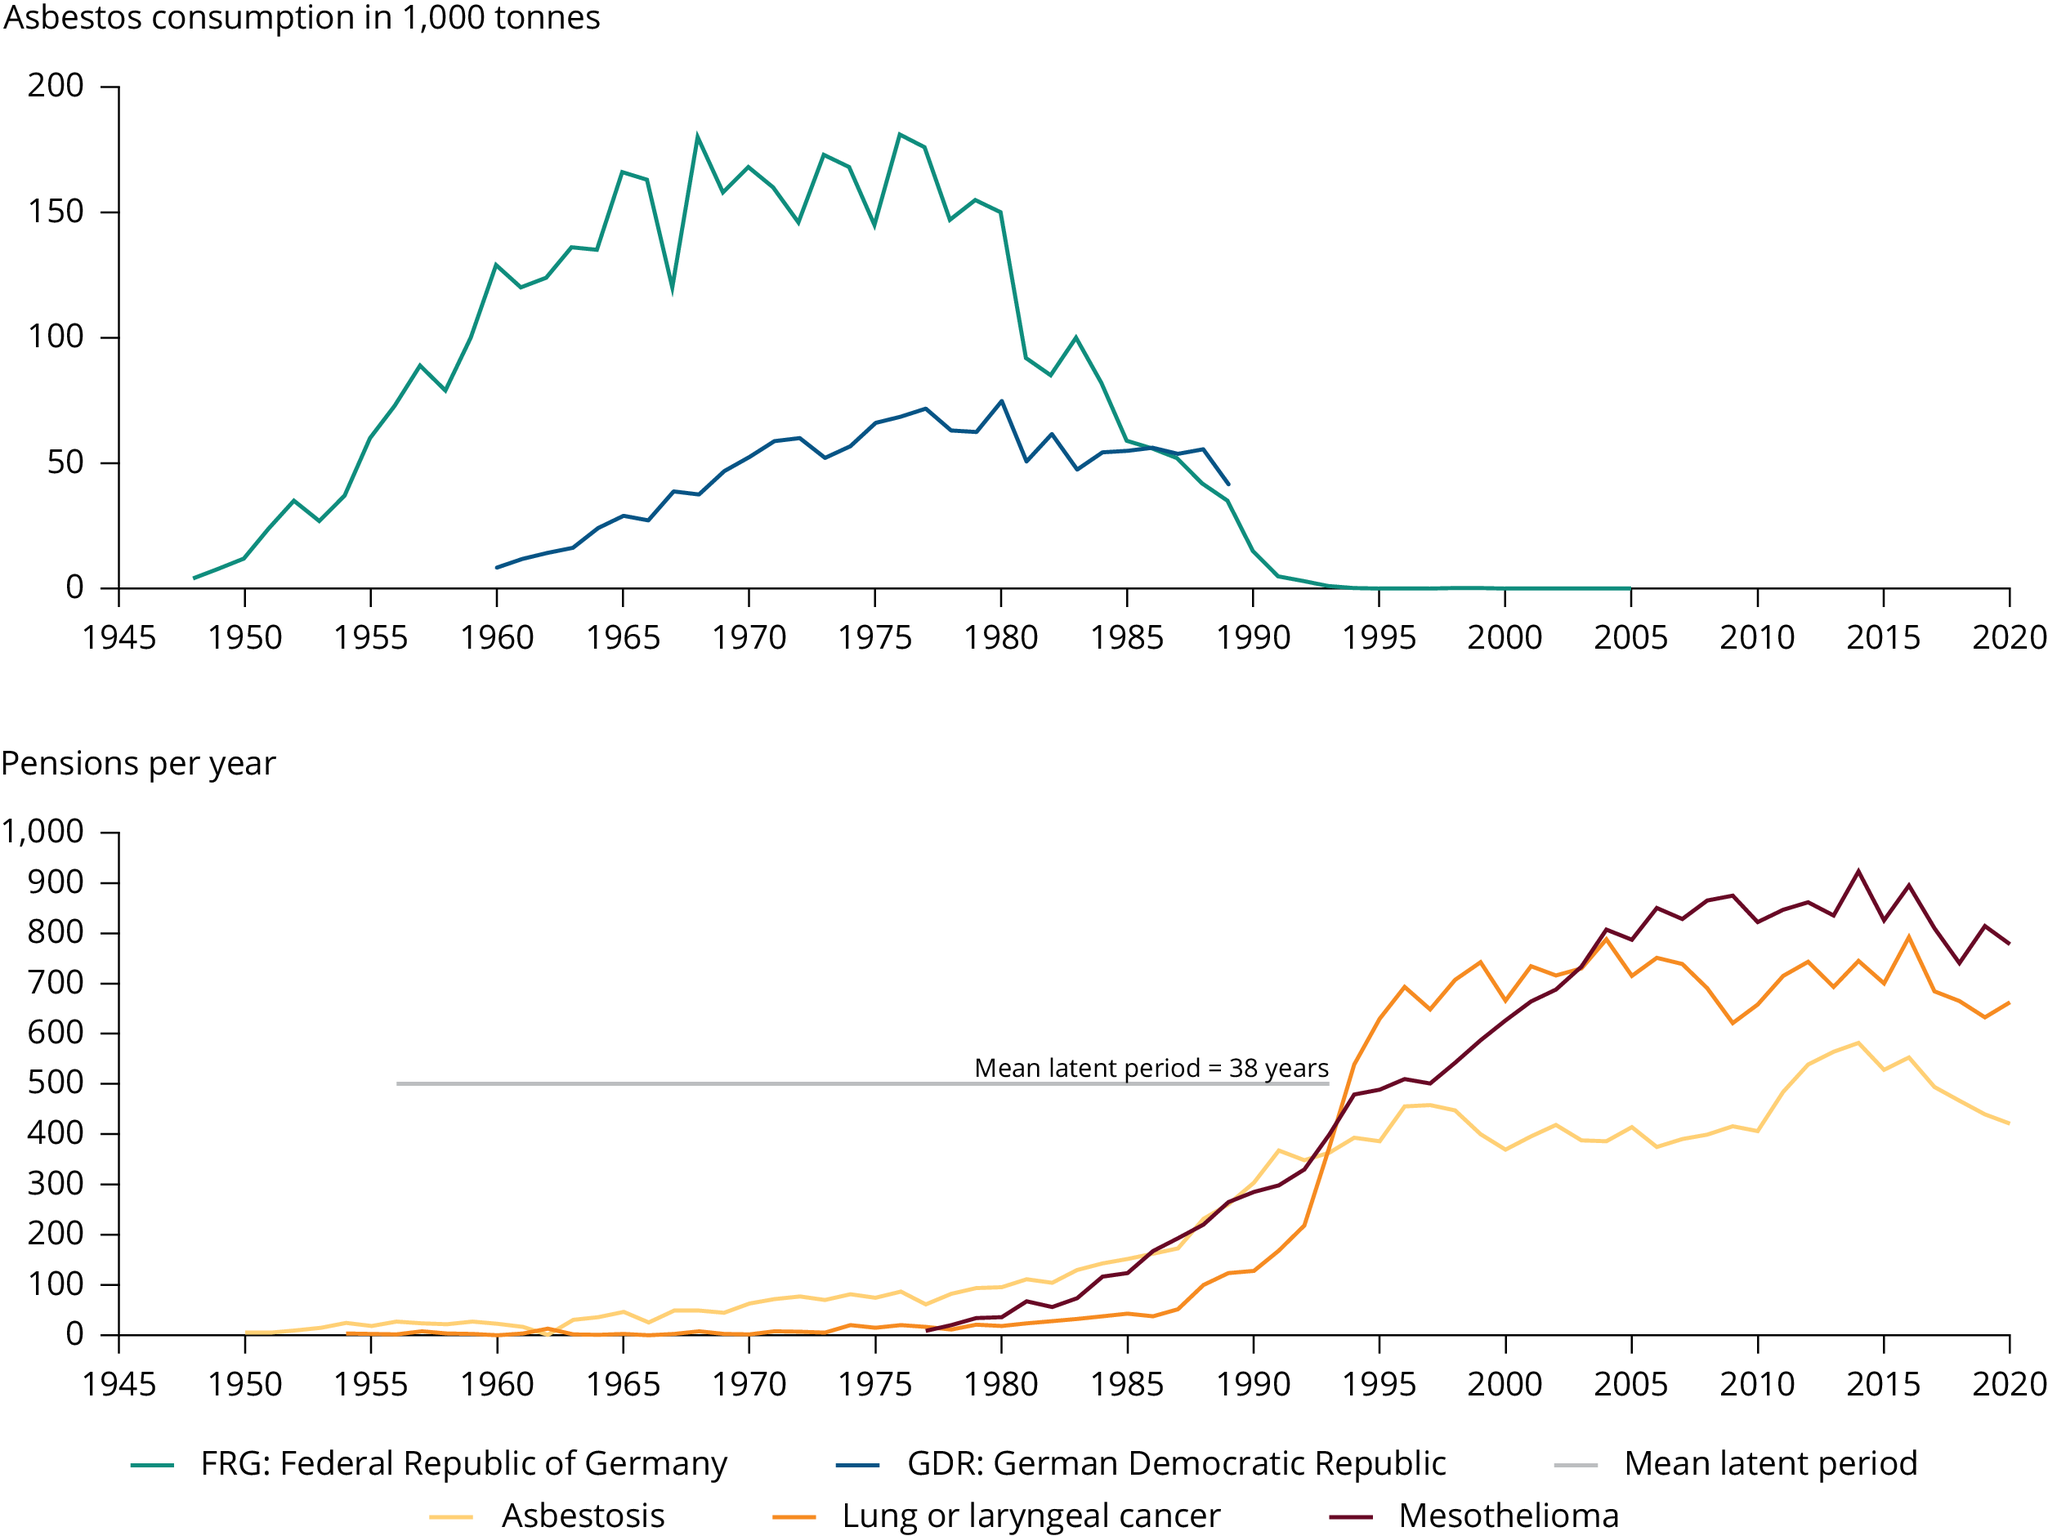
Exposure can lead to diseases such as asbestosis and mesothelioma and other forms of cancer. Although the EU banned its marketing and use in 2005, asbestos remains one of the main causes of work-related cancers. Most asbestos-related diseases develop in people who work or used to work with asbestos. The symptoms of asbestosis can take 10-20 years to appear, and signs of asbestos-linked cancers can take up to 40 years.
As an example, Figure 1 illustrates the long time lag between asbestos exposure and asbestos-related occupational diseases in Germany.
Source: Data provided directly by Dr Markus Mattenklott, Institute for Occupational Safety and Health of the German Social Accident Insurance (IFA) (unpublished data). Data on new pensions are from DGUV (2021).
Click here to view the figure enlarged
Click here for different chart formats and data
According to the International Commission on Occupational Health (2019), exposure to asbestos claims about 88,000 lives in Europe each year and accounts for 55-85% of lung cancers developed by workers. Mortality rates from asbestos exposure are expected to continue to increase until the 2030s.
Exposure to asbestos will be a health risk during the renovation wave, which aims to make buildings fit for a climate-neutral future in the context of the European Green Deal. The European Commission is working on a stronger legal framework to better protect workers by lowering the occupational limit values for asbestos. At the national level, European countries should raise awareness of the risk that comes with the renovation wave in terms of inadvertently releasing asbestos. An example is a new platform by the German Institute for Occupational Safety and Health, which provides comprehensive and easy-to-understand guidelines and information for those affected.
DGUV, 2021, Geschäfts- und rechnungsergebnisse der gewerblichen berufsgenossenschaften und unfallversicherungsträger der öffentlichen hand 2020, Deutsche Gesetzliche Unfallversicherung (https://publikationen.dguv.de/widgets/pdf/download/article/4339) accessed 14 November 2022.
European Commission, 2012, Practical guidelines for the information and training of workers involved with asbestos removal or maintenance work, European Commission, Brussels, (https://ec.europa.eu/social/BlobServlet?docId=7478&langId=en) accessed 18 October 2022.
International Commission on Occupational Health, 2019, ‘Workers’ health should not be jeopardised in order to make buildings energy efficient’, European Economic and Social Committee (https://www.eesc.europa.eu/en/news-media/news/workers-health-should-not-be-jeopardised-order-make-buildings-energy-efficient) accessed 18 October 2022.
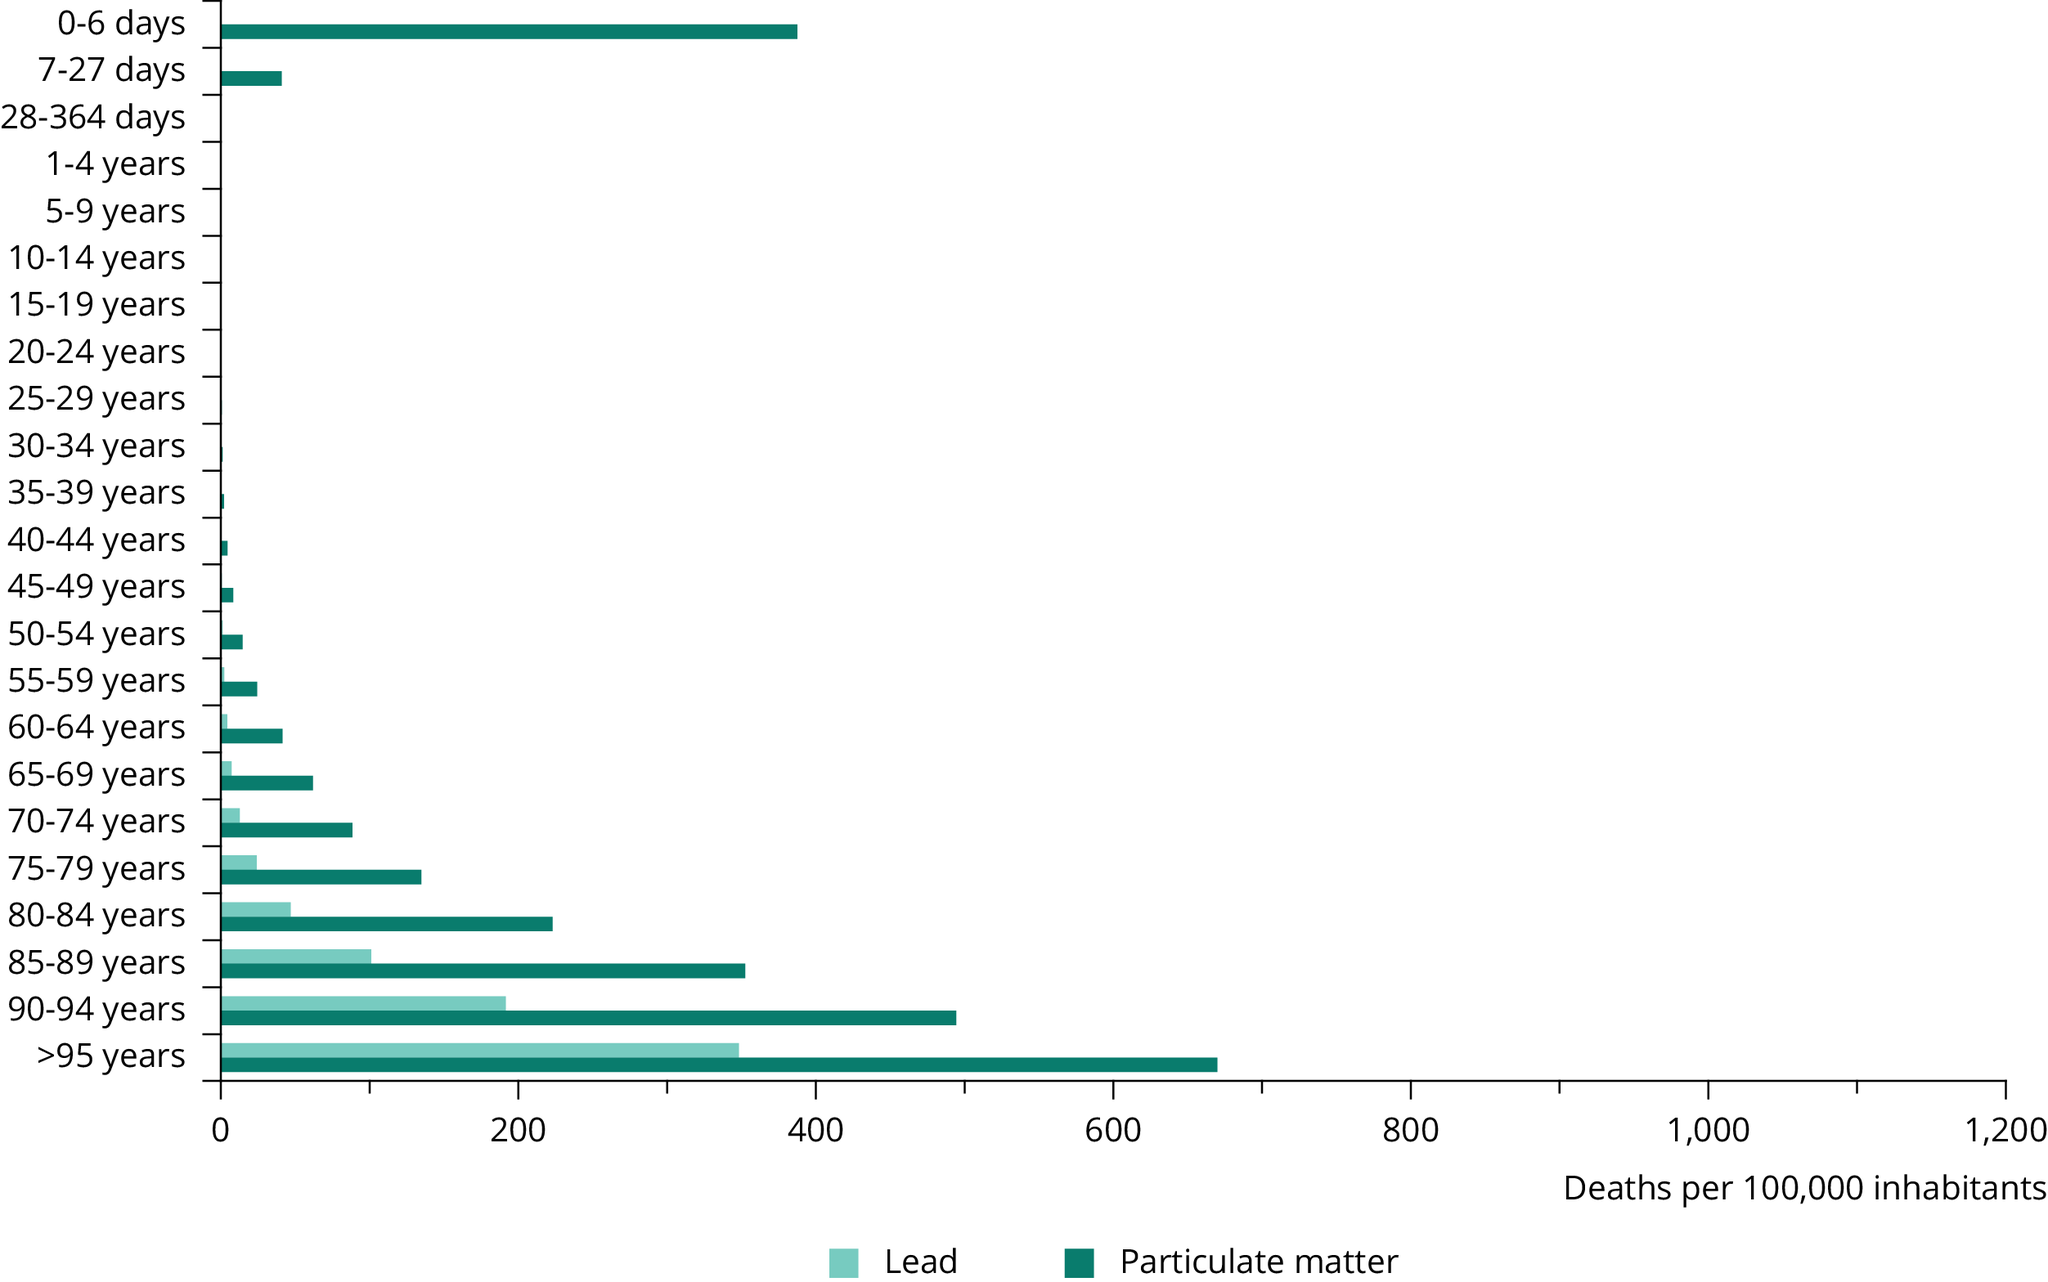
Pollution disproportionately impacts certain vulnerable groups in society. The estimated number of premature deaths related to air pollution and exposure to lead are shown in Figure 1. The figure illustrates the impact that air pollution and lead exposure has on both young children and elderly people.
Source: Institute for Health Metrics and Evaluation data on environmental burden of disease (IHME, 2022).
Click here for different chart formats and data
Children are particularly vulnerable to exposure to pollution in their early years or in the womb. This can lead to lifelong, irreversible effects on their physical and mental well-being. For example, exposure to mercury while in the womb impacts IQ for life (EEA, 2018a). Exposure to noise also inhibits children’s performance in school (EEA, 2018b).
Similarly, elderly people are less able to cope with the impacts of pollution, and underlying illnesses can also make them particularly vulnerable.
Moreover, groups of lower socio-economic status (unemployed people, and people with low incomes or lower levels of education) tend to be more exposed to and affected by environmental pollution (EEA, 2018b). Socially disadvantaged populations tend to have fewer resources to cope with an environmental pollution burden (WHO Europe, 2019). For example, they may not have the financial resources to move from a polluted area; they also tend to have less access to healthcare than wealthier individuals.
EEA, 2018a, Mercury in Europe’s environment — a priority for European and global action, EEA Report No 11/2018, European Environment Agency (https://www.eea.europa.eu/publications/mercury-in-europe-s-environment) accessed 21 October 2022.
EEA, 2018b, Unequal exposure and unequal impacts: social vulnerability to air pollution, noise and extreme temperatures in Europe, EEA Report No 22/2018, European Environment Agency (https://www.eea.europa.eu/publications/unequal-exposure-and-unequal-impacts) accessed 21 October 2022.
IHME, 2022, ‘GBD compare’, Institute for Health Metrics and Evaluation (https://vizhub.healthdata.org/gbd-compare/) accessed 18 October 2022.
WHO Europe, 2019, Environmental health inequalities in Europe — second assessment report, World Health Organization Regional Office for Europe, Copenhagen (https://apps.who.int/iris/bitstream/handle/10665/325176/9789289054157-eng.pdf) accessed 21 October 2022.
Black carbon and elemental carbon and ultrafine particles are examples of emerging air pollutants that present health risks. However, we do not yet know enough about them to establish health guidelines. More positively, the World Health Organization (WHO) recently set the objectives of developing good practices to manage these pollutants and of promoting further research on their risks and mitigation approaches.
While the health risks associated with PM2.5 (particulate matter with a diameter of 2.5μm or less) are well known, evidence is emerging that the specific composition of particles significantly influences health. For example, oxidants in particulate matter present a significant health risk (Sarnat et al., 2016); therefore, the oxidative potential (OP) of particulate matter is emerging as a key parameter for identifying the health risk posed by these particles. Secondary PM2.5 (i.e. particles formed through chemical reactions in the atmosphere) is an important component of PM2.5; this is especially true in urban areas, where it accounts for around 70% of annual PM2.5 concentrations (Amato et al., 2016; see also the AIRUSE project). Among these secondary PM2.5 components, secondary organic aerosols (SOAs) are increasingly significant as a result of the reduction in secondary inorganic aerosols (SIAs) in Europe over the last few decades. SOAs are linked to hazardous effects on human health (Delfino et al., 2010; Decesari et al., 2017; Park et al., 2018; Zhang et al., 2018a; Chowdhury et al., 2019) and anthropogenic SOAs are known as one of the main drivers of the OP of particulate matter in Europe (Daellenbach et al., 2020). This indicates that, although overall PM2.5 levels are decreasing, the higher proportion of SOAs may increase the relative health risks posed by particles (Zhang et al., 2018b).
The Horizon 2020 project RI-URBANS will provide an in-depth evaluation of the OP of particulate matter in several cities. In addition, the European Commission has issued a systematic assessment of the monitoring of air pollutants not covered under the ambient air quality directives (EC, 2022). The purpose of this report is to identify other pollutants of concern based on scientific recommendations, gather information on how these are monitored, evaluate how far the EU is from following WHO-recommended practices and provide advice for meeting scientific recommendations. The pollutants analysed, apart from the ones highlighted above, are ammonia, methane, 1,3-butadiene, formaldehyde, manganese and vanadium.
Measurements of most of these pollutants are already reported, mainly to the EEA’s e-reporting database and the EBAS database hosted by the Norwegian Institute for Air Research (NILU).
Amato, F., et al., 2016, ‘AIRUSE-LIFE+: a harmonized PM speciation and source apportionment in five southern European cities’, Atmospheric Chemistry and Physics 16(5), pp. 3289-3309 (https://doi.org/10.5194/acp-16-3289-2016).
Chowdhury, P. H., et al., 2019, ‘Connecting the oxidative potential of secondary organic aerosols with reactive oxygen species in exposed lung cells’, Environmental Science and Technology 53(23), pp. 13949-13958 (https://doi.org/10.1021/acs.est.9b04449).
Daellenbach, K. R., et al., 2020, ‘Sources of particulate-matter air pollution and its oxidative potential in Europe’, Nature 587, pp. 414-419 (https://doi.org/10.1038/s41586-020-2902-8).
Decesari, S., et al., 2017, ‘Enhanced toxicity of aerosol in fog conditions in the Po Valley, Italy’, Atmospheric Chemistry and Physics17(12), pp. 7721-7731 (https://doi.org/10.5194/acp-17-7721-2017).
Delfino, R. J., et al., 2010, ‘Associations of primary and secondary organic aerosols with airway and systemic inflammation in an elderly panel cohort’, Epidemiology 21(6), pp. 892-902 (https://doi.org/10.1097/EDE.0b013e3181f20e6c).
European Commission, 2022, Systematic assessment of monitoring of other air pollutants not covered under Directives 2004/107/EC and 2008/50/EC, Publications Office of the European (https://data.europa.eu/doi/10.2779/691266) accessed 3 November 2022.
Park, M., et al., 2018, ‘Differential toxicities of fine particulate matters from various sources’, Scientific Reports8, pp. 1-11 (https://doi.org/10.1038/s41598-018-35398-0).
Sarnat, S. E., et al., 2016, ‘Ambient PM2.5 and health: does PM2.5 oxidative potential play a role?’, American Journal of Respiratory and Critical Care Medicine 194(5), pp. 530-531 (https://doi.org/10.1164/rccm.201603-0589ED).
WHO, 2021, WHO global air quality guidelines. Particulate matter (PM2.5 and PM10), ozone, nitrogen dioxide, sulfur dioxide and carbon monoxide, World Health Organization, Geneva (https://apps.who.int/iris/handle/10665/345329).
Zhang, H., et al., 2018a, Physical and chemical characteristics of PM2.5 and its toxicity to human bronchial cells BEAS-2B in the winter and summer, Journal of Zhejiang University-Science B 19, pp. 317-326 (https://doi.org/10.1631/jzus.B1700123).
Zhang, W., et al., 2018b, Triggering of cardiovascular hospital admissions by fine particle concentrations in New York state: before, during, and after implementation of multiple environmental policies and a recession, Environmental Pollution242, pp. 1404-1416 (https://doi.org/10.1016/j.envpol.2018.08.030).
Cover image source: © Evangelija Ivanoska, Well with Nature /EEA
For references, please go to https://www.eea.europa.eu/publications/zero-pollution/health/signals/air or scan the QR code.
PDF generated on 18 Sep 2024, 05:54 PM
Engineered by: EEA Web Team
Software updated on 26 September 2023 08:13 from version 23.8.18
Software version: EEA Plone KGS 23.9.14
Document Actions
Share with others