6. Testing the Concepts - Examples from the Paper, Textile and Surface Treatment Industry
The following work is based on information from the EDIP unit process database and cleaner technology projects performed by the Institute for Product Development. The relevant data have been collected and hand-led following the principles in the EDIP method and in Chapter 4 of this report.
Due to the purpose of these case studies, information regarding the various stages of the product life cycle has been omitted. The final step of the valuation, weighting, will be shown, and the indicators at the life cycle assessment level are discussed.
The purpose of the cases is to document and illustrate:
- That a cleaner technology should always be assessed both in the process dimension and the product dimension.
- That the product dimension, i.e. the life cycle of the product, can be influenced by the technology and that this influence is often environmentally decisive.
How important the product dimension is, compared to the process dimension.
- That environmental performance can be controlled by "technology specific indicators", which are the process parameters respectively the product parameters that are decisive to the environmental performance.
- That such process parameters and product properties are easy to identify on the basis of sufficient technological and environmental knowledge of the technology, and that they are easy to use in the control of environmental performance.
The cases thus illustrate the working principles described in Section 5.5 and illustrated in Figure 5.1, and demonstrate that these working principles can be applied in practice.
The EPIs used in the work with the cases are the EPIs of the EDIP method. These are not transformed to the level 0 and level 1 EPIs of the CEIDOCT concept. However, for the indicators of the focus areas M, E and C, the information to perform this transformation is present in the EDIP-EPIs as shown in the following diagram (ref. Figure 3.1):
Assessment parameters in the EDIP-method, related to the CEIDOCT-EPIs level 0 and 1 for focus areas M, E and C
| |
Environmental
Impacts |
Resource
consumption |
Impacts
on the working environment |
Materials
Focus area M
|
Bulk waste
Slag and ashes |
Resources used in materials
Mainly reversible consumption
|
|
Energy
Focus area E
|
Global warming
Photochemical ozone formation
Acidification
Nutrient enrichment
Bulk waste
Slag and ashes
Nuclear waste |
Energy carriers, especially fossil resources and
wood.
Mainly irreversible consumption.
|
|
Chemicals |
|
|
|
Focus area C |
Ozone depletion
Photochemical ozone formation
Persistent toxicity
Ecotoxicity
Human toxicity
|
Resources used in
the production of chemicals |
Impacts related
to chemical exposure: cancer, damage to the reproductive system, allergy
and damage to the nervous system |
| |
Hazardous waste |
|
|
Others |
|
|
Monotonous
repetitive work, noise, work accidents |
Thus, direct relations exist between the EDIP-EPIs and the CEIDOCT focus areas M, E and C. For focus area B this is not the case as the biological resources area is not included in EDIP or any other present LCA-method. The B-indicators have not been sufficiently developed in this project to be calculated in the cases.
6.1 Paper case: Recovery process for fluting and test-liner
Process to be assessed
The process to be assessed in the present case is the production process of recycled fluting and test-liner, i.e. the recovery process for fluting and test-liner.
Superior service
The superior service of the product (fluting and test-liner) is to serve as packaging of goods.
The functional unit
The functional unit is the production of 232,500 tons of recycled fluting and test-liner, calculated as dry matter. The Figure chosen corresponds to a realistic annual production for a company.
6.1.1 Reference technology, process and product dimension
The reference process: Production of recycled fluting and test-liner
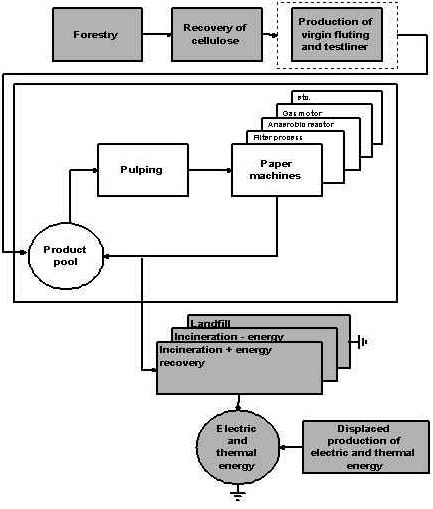
The production of recycled fluting and test-liner can roughly be divided into two sections: the pulping process and the paper making process as shown in Figure 6.1.1.
Figure 6.1.1: Flow chart of recycled fluting and testliner
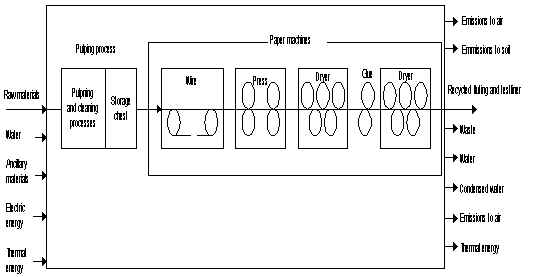
The pulping stage
The pulping stage is the process in which the raw materials are treated physically and chemically in order to achieve the desired qualities of the paper pulp. This is done by pulping, removing contaminants (sand, metals, stickies, etc.) and screening. The final paper pulp in the storage chest has a consistency of approx. 4-5% dry matter.
Paper making
The paper making stage is subsequently divided into 5 minor stages:
- the wire, where the paper web is formed.
- the press, where the paper web is pressed to a consistency of approx. 50%.
- the drying press, where the paper web is dried to a consistency of approx. 85% dry matter.
- the glue press that glues the paper web.
- the final drying press, where the paper is dried from a consistency of 60% dry matter to a consistency of 93% dry matter.
After the final drying process the paper web is rolled onto reels and stored for sale.
The reference product: Corrugated cardboard
A simplified life-cycle for recycled corrugated cardboard is shown in Figure 6.1.2.
Figure 6.1.2: Life cycle for recycled corrugated cardboard
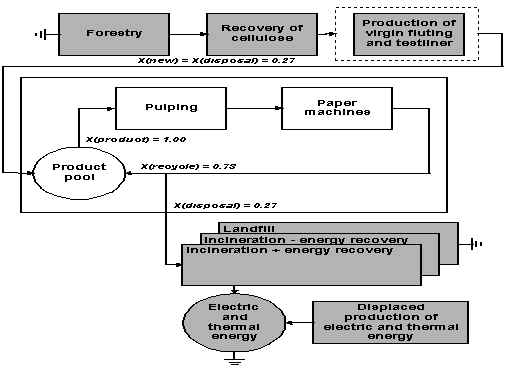
The dotted box around the production of virgin fluting and test-liner implies that this process is not included in the inventory. This is due to the allocation model used in this LCA. This model will not be described further. The X values serve as an illustration of the utilized recycling fraction. For every unit produced fluting and test-liner 27% is disposed of. In order to obtain a constant mass in the closed recycling loop an equal amount of new fibres have to be admitted into the loop so X(recycle) + X(new) always equals 1. The paper removed from the recycling loop is subsequently disposed by sending to landfill, incinerating without energy recovery or incinerated with energy recovery. If the paper is incinerated with recovery of energy, the energy produced, electric and thermal will displace other energy productions which will lead to savings in consumption of resources (coal, natural gas, etc.). Subsequently, the mass of paper taken out of the system has to re-enter as fresh fibre mass. This is done by collecting virgin corrugated cardboard. With this system an equilibrium is reached so the quality and quantity of paper fibres in the recycling loop is constant.
The environmental aspects of used cardboard recovery and sorting is not included.
Discussion of process versus product system.
From an LCA of recycled corrugated cardboard, Figures 6.1.3 and 6.1.4, it can be seen that most of the impacts actually derive from the production process itself.
Most of these are due to the energy consumption at the production facility for recycled fluting and test-liner.
Figure 6.1.3: Weighted environmental impact potentials for the production of corrugated cardboard and for the total life cycle respectively
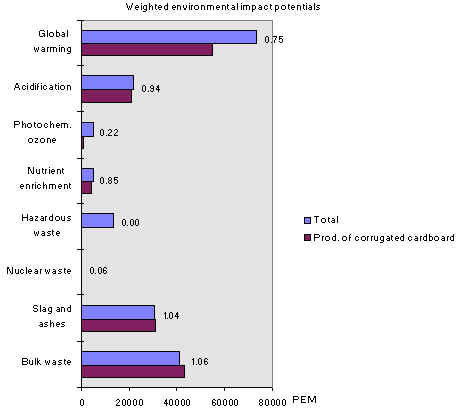
In Figure 6.1.3 is shown weighted environmental impact potentials for global warming, acidification, slag and ashes and bulk waste and as shown, the studied process is responsible for 25-100% of the impacts from the whole life-cycle of the product. The Figures next to the columns indicate the proportion of the process as related to the whole product system. The reason why this ratio can be >1 is due to the incineration of used corrugated cardboard with energy recovery displaces alternative production of energy.
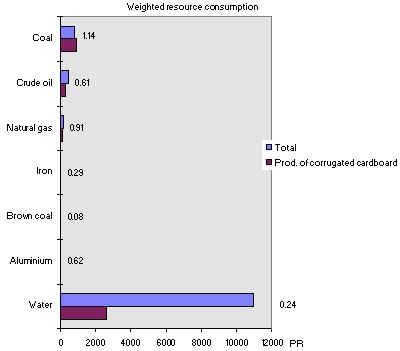
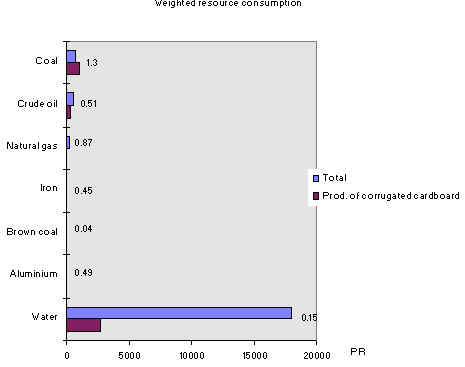
The displacement of energy also explains the ratio for coal shown in Figure 6.1.4.
Figure 6.1.4: Weighted resource consumption for the production of corrugated cardboard and the total life cycle respectively
The technology influences the products environmental performance in several ways. One of the most obvious is the pulping process, where most of the wear and tear on the paper fibres occurs. A reduction of the impacts on the fibres in this process would affect the product in a number of ways:
- the strength of the paper fibres would be increased
- the strength of the paper would be increased
- the finished product could be made thinner without influencing its strength
- reduction of raw materials consumption
- reduction of energy consumption
While improving the environmental performance of the process itself, these parameters will also influence the essential product properties and thereby improve the environmental performance of the product.
6.1.2 Cleaner technology assessment in the process dimension
Process modification
As mentioned earlier the investigated production facility has a closed water system. This means that no waste water is emitted, but treated and returned to the main process water flow. This has resulted in a number of problems arising in the production:
- reduced quality of product
- reduced efficiency of machinery
- deposits in machinery
- increased wear
- corrosion
- foul odour
- increased bacterial growth
Filtration process
In order to solve these problems in a non-chemical way it was decided to investigate the use of a filtration process (Figure 6.1.5) followed by an anaerobic reactor for the production of methane (Figure 6.1.6).
Figure 6.1.5: Filtration principle
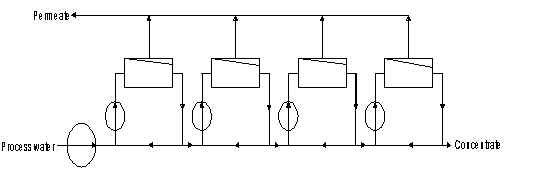
Figure 6.1.6: Anaerobic reactor for the production of methane
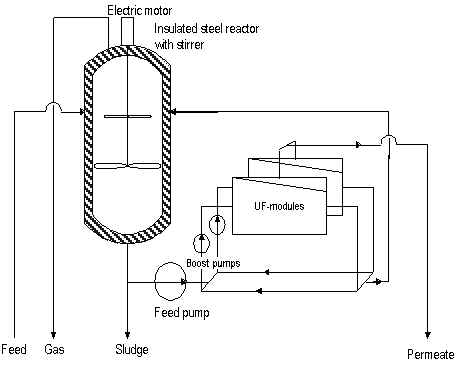
The methane was to be utilized in a gas motor, producing electricity and the sludge was to be pressed and incinerated at a nearby incineration plant.
With the new processes the life cycle of the product system of fluting and test-liner will be as shown in Figure 6.1.7.
Figure 6.1.7: Life cycle of system with the implementation of cleaner technology
If compared to the reference product system (Figure 6.1.2), it can be seen that the life cycles of the cleaner technologies have been included in the new model.
Environmental impacts of implementation of cleaner technology
As a result of the filtration process the final product will contain less COD. Because the COD is a main factor in the production of methane gas at landfills this emission of greenhouse gas from landfills will be reduced.
As before, it is global warming, acidification, slag and ashes, bulk waste and water consumption that characterise the environmental profiles as shown if Figure 6.1.8 and 6.1.9.
Nickel has been included as a new resource. This mainly comes from the filtration plant that, due to the highly corrosive nature of the process water, is made of stainless steel.
Figure 6.1.8: Weighted environmental impact potentials of system with the implementation of cleaner technology
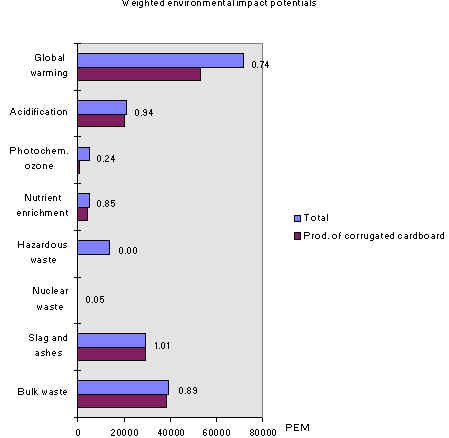
Figure 6.1.9: Weighted resource consumption for the system with the implementation of cleaner technology
The new processes themselves do not have much of an effect on the profiles, but the gas motor contributes with relatively large reductions. The energy produced is larger than the consumption of the filtration process and the anaerobic reactor thereby causing a total decrease in energy consumption from the production system.
A factor not mentioned earlier is the consumption of ancillary substances (biocides, flocking agents, etc.). Introducing the mentioned cleaner technologies it should be possible to reduce the consumption of ancillary substances by approx. 30%, with some of the substances being reduced by up to 50%.
6.1.3 Cleaner technology assessment in the product dimension
Life time for paper fibres
In the reference system, 27% of the fibres are disposed of in each recycling loop. If the disposal rate could be reduced, a reduction of the amount of new fibres would be the result. According to experience from the industry a paper fibre can stand up to 6 times of use. Theoretically this means that for each recycling stage 1/6 of the paper fibres have lost so much material grade that they have to be taken out of the recycling loop in order not to reduce the overall paper quality. An illustration of this scenario, according to Figure 6.1.2 would be:
X(recycle) = 5/6 = 0.83
X(disposal) = X(new) =1/6 = 0.17
The environmental profiles of this scenario can be seen in Figures 6.1.10 and 6.1.11.
Figure 6.1.10: Weighted environmental impact potentials for system with altered life time of paper fibre
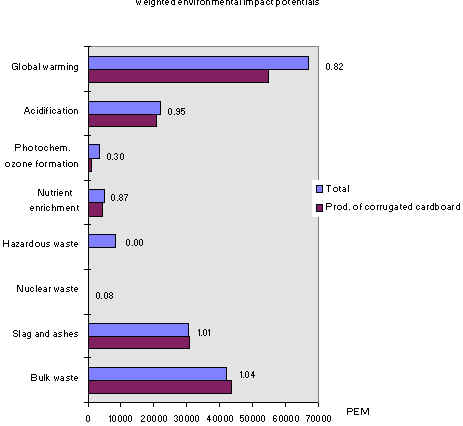
Figure 6.1.11: Weighted resource consumption for system with altered lifetime of paper fibre.
If we compare these figures to Figures 6.1.3 and 6.1.4 we will see that the ratios have become closer to 1. This can be explained by the fact that the surrounding product system contributes to a smaller part of the product system.
Recycling rate
If the recycling percentage was lowered to a mere 50%, so:
X(recycling) = 0.50 and X(new) = X(disposal) = 0.50,
the environmental and resource profiles would be as illustrated in Figures 6.1.12 and 6.1.13.
Figure 6.1.12: Weighted environmental impact potentials for a system with recycling percentage of 50%
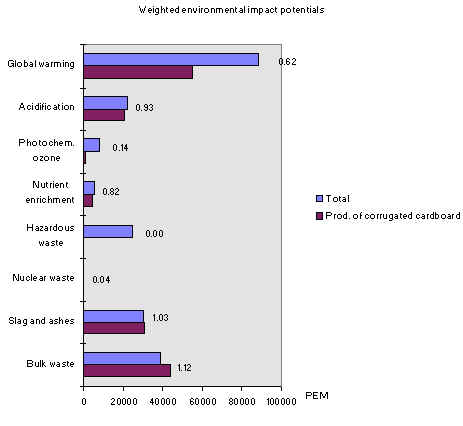
Figure 6.1.13: Weighted resource consumption for a system with recycling percentage of 50%
This exemplifies the exact opposite of the Figures 6.1.3 and 6.1.4. Here the ratios have moved further away from the value 1. Mathematically this can be explained as:
So, the higher the utilised recycling potential, the less important the surrounding product system.
6.1.4 Technology specific EPIs
In order to control environmental performance, technology specific indicators which are related to the process parameters and the product properties respectively, can be defined.
The process dimension of environmental performance
There are many factors in the technology that are of environmental importance, as seen in the environmental and resource profiles. These are illustrated by the ratios. If they have a value close to 1 the main improvement potential will be located in the process, if not, the main improvement potentials for the product system are to be found in the surrounding product system. In the process, specific improvement potentials are illustrated by global warming, acidification, slag and ashes and bulk waste. Together with coal and natural gas they mainly represent consumed energy. The metals present in the cleaner technology scenario are not considered important. The resource profile for water is not representative for all manufactures of recycled paper (mentioned earlier). Many other manufactures will have a consumption that is considerably larger.
Another important property of the process is the amount of consumed ancillary substances, not mentioned earlier. It has been proven that the overall consumption of chemicals can be reduced by 30%, some up to 50%. This will have a considerable impact of toxicology, but due to deficiency of data these impacts have not been proven.
To sum up on the process dimensions that will influence the environmental performance of the product, they are:
- consumption of energy
- consumption of ancillary substances
- (consumption of water)
The product dimension of environmental performance
The product dimension of environmental performance is the technology's influence on the product's performance. The environmental performance of the product is determined by a number of its key properties. In the case of fluting and test-liner examples of essential properties are:
- fibre quality (determine the residual life time of the fibre)
- strength/weight relationship
Lifetime
Experience shows that the lifetime of a paper fibre is in practice determined by the number of recycling steps the fibre has been through. A paper fibre can according to the industry be used 6 times before the material grade is reduced to a quality too low for the production of paper (it must be noted that durability depends on many factors, and the durability of fibres in a recycling system is not a scalar but a probability distribution). With an increased amount of paper being recycled the single paper fibre is increasingly used in more products. This means that many of the paper fibres are more worn. Paper fibres that have lost "all" of their material grade qualities are called "0-fibres", the only function these fibres have is as inert fillers that reduce the strength of the paper or pollutants in the waste water.
A major part of the wearing down of the fibres happens in the pulping process (see Figure 6.1.3) where the fibres are exposed to physical and chemical wear and in the drying stage, where the heat causes irreversible structural changes in the cell wall of the fibre (hornification).
The higher the wear on the fibre in the recovery process, the higher the environmental impact from the product. When the fibre is worn, the need for primary paper production increases and thus the impacts from the parts of the product system external to the recovery process itself.
Strength/weight
The manufacturers of fluting and test-liner have certain demands, derived from their customers, as to the strength of the cardboard. These demands are fulfilled by alternating the specific gravity, e.g. g per m2. Increased thickness is obtained by increasing the amount of consumed raw materials (mostly recycled cardboard) per produced m2.
The strength of the paper is a property affected by many parameters, e.g. length of paper fibre, thickness of the sheet, amount of inorganic fillers, amount of glue, etc. When producing paper with a greater amount of "used" fibres, as mentioned above, one could expect that the quality of the final paper will fall. Measurements of strength from producers of recycled fluting and test-liner show the exact opposite. Their Figures show increased strength even with lighter paper (g per m2). This is explained by process optimizations (it has not been specified if these optimizations are technological or physical, i.e. increased amount of consumed starch per basis weight). But again, the influence of the studied process on this essential product property is highly essential to the environmental impact of the product, when providing its superior service, namely packaging of goods. If the process increases the strength/weight relationship, and the customers demands cardboard with reference to the strength of the cardboard and not only focuses on the weight, the process would cause the need for less weight for the same overall service of the product. This would again imply decreased environmental impact from the product system external to the studied process itself.
6.1.5 Conclusions
The conclusions from this case are:
- that the process dimension is the decisive parameter for the environmental performance of the corrugated cardboard. This means that environmental improvements of the process will significantly improve the environmental performance of the product.
- that increasing the recycling rate makes the process dimension even more important.
- that the environmental performance can be controlled by using the technology specific indicators.
6.2 Textile case: Reactive dyeing of cotton
Process to be assessed
The process to be assessed in the present case is reactive dyeing of cotton knitwear in batch machines.
This batch is widely known and is increasingly being used. Cotton represents approximately half of all textiles world-wide, and nearly all cotton is today dyed by reactive dyes.
The product to be assessed
The product that is to be assessed in the present case is a dyed T-shirt of 250 g 100% cotton.
A T-shirt is defined as a lightweight, weftknitted, unadorned, crew-neck, short or long sleeved garment, giving a T-shape when laid flat, designed for outerwear. T-shirts covered by these criteria must not be equipped with buttons, ribs or a collar made of other materials.
The average consumer's annual requirement for such T-shirts is defined as 75 times of use or in practice as washing 75 times and drying 45 times in a household dryer. If a given quality of a dyed T-shirt can stand washing 75 times and drying 45 times in a household dryer, before being classified as worn out, this T-shirt will have a lifetime of one year.
Superior service
The superior service of the product is to serve as clothing. The functional unit is:
The functional unit
Number of T-shirts needed to meet a consumer's demand for one year, i.e. washing 75 times and dried in a household dryer 45 times.
6.2.1 Reference technology, process and product dimension
The reference process: Reactive dyeing of cotton
The dyeing process of knitted cotton fabric can be divided into four stages: pre-treatment, dyeing, rinse and finish. In this reference case all these stages take place in the same machine shown in Figure 6.2.1:
Figure 6.2.1: Jet dyeing machine. Vald. Henriksen A/S
Pre-treatment
The pre-treatment prepares the fabric for further manufacturing and can be divided into two stages:
- Washing and bleaching to remove impurities such as waxes, grease and natural colour to ensure a uniform clean, white textile.
- Neutralising and rinsing that ensures that the bleaching chemicals are removed from the fabric.
Dyeing
The dyeing process consists of a number of process steps, where pH, temperature and ion strength are used to ensure that the colour intensity and fastness of the product match that required by the customer.
Rinse
During rinsing the surplus dye-stuff, which is not fixed on the textile, is washed off, and the product is nearly finished.
Finish
Finishing is a process that allows the manufacturer to add one or several qualities to the final product. When talking about knitted cotton, the finish consists of treatment with antistatic and softening agents in order to decrease interfibre friction during sewing.
The reference product: A cotton T-shirt
A simplified life cycle for a cotton T-shirt is shown in Figure 6.2.2:
Figure 6.2.2: Product system. Cotton from seed to waste
Growing and harvesting
The life cycle of cotton fibres starts with the growing and harvesting of the cotton. Harvesting is done by machines, requiring application of defoilaging agents before harvesting. The harvested cotton does not only consist of pure cotton fibres but also of cotton seeds and other impurities (soil, twigs, leaves etc.). These impurities are cleaned off, and the pure cotton fibre is baled and sent to further processing.
Seeds
The cotton seeds are utilised in different ways. A small fraction is returned to the cotton farmers for new crops. The main fraction is used for other products such as cotton oil and animal feed. This gives rise to an allocation problem. The income from the sale of cotton is higher than the income from cotton seeds, and an economical allocation model has been used.
Impurities
All other impurities are treated as terminal waste.
Cotton fabric
The cleaned and baled cotton fibres is sent to the spinner. Here the fibres are spun into cotton yarn. The cotton yarn is knitted into cotton fabric and dyed with reactive dyestuffs in a jet dyeing machine.
Manufacturing of T-shirts
The dyed fabric is cut and sewn into T-shirts with a weight of 250 g per T-shirt. Assessments of the environmental impacts from these processes have outlined the energy consumption, including the energy consumption for compressed air, as the only impact worth mentioning. The manufacturing process is not included in the following environmental assessment.
Use
The use is characterized by washing and dying processes. Regarding environmental impacts and resource consumption, these processes can be of paramount importance compared to the rest of the life cycle.
Disposal
In the disposal stage of the T-shirts, these are treated as normal household waste.
Discussion of the process versus the product system
The LCA of the T-shirt can be expressed in an environmental profile in Figure 6.2.3 and a resource profile in Figure 6.2.4. It is seen that the use stage is the most dominant. This is due to the washing and drying processes during this stage of the product life cycle. The environmental impact categories all demonstrate that this stage is very energy consuming. The water consumption in the resource profile can also be ascribed to the washing process.
Figure 6.2.3: Weighted environmental impact potentials for a cotton T-shirt
Growing and harvesting of cotton is also seen to have noticeable impacts. These are due to the burning of fossil fuels.
From a product LCA point of view the impacts from the remaining stages in the product system are negligible.
Figure 6.2.4: Weighted resource consumption for a cotton T-shirt
It can be concluded, that the environmental impacts from the life cycle of a cotton T-shirt predominately is governed by its use stage and secondarily by the growing and harvesting of the cotton.
Lifetime
Figure 6.2.5 illustrates the global warming potential as a function of the number of T-shirts needed to meet the demand for a person in one year. The impact from the use stage is constant, i.e. independent of how many T-shirts the person needs. In contrast, the impact from the product life cycle excl. use is directly proportional to the number of T-shirts needed. The total global warming potential from the life cycle incl. use is obtained by adding two curves. It can be seen that from one high quality T-shirt, which can stand 75 washing cycles (one T-shirt used per year), the impacts will mainly come from the use stage. On the contrary it can be seen that from a low quality T-shirt, which can stand only 5 times washing (15 T-shirts used per year), the impacts from the rest of the product life cycle become as weighty as the rest of the use stage - and the total global warming impact from the low quality T-shirt is double that of the high quality T-shirt.
Figure 6.2.5: Weighted global warming impact as a function of T-shirt lifetime
Cleaner technology assessment in the process dimension
Process modifications
The investigated cleaner technology process modification is rinsing after dyeing. In the investigated system 60% of the total water consumption and 20% of the total consumption of chemicals in the dyehouse processes have been saved. This has been accomplished by introducing a new dyeing method in the dyehouse and by upgrading and reuse of rinsing water by membrane filtration. The concentrate from the membrane filtration is utilized in a biogas reactor.
DLCA
The process modification results in large improvements of the environmental impacts from the rinsing. This is illustrated by Figure 6.2.6 that compares the impacts from dyeing and rinsing.
Figure 6.2.6: Weighted environmental impact potentials for the dyeing process
System 1 and 2 versus the reference system, System 0
The Figure shows three alternative systems, namely system 0, the reference system earlier described, system 1, the above-mentioned improvement, and finally system 2, dyeing and rinsing in an old-fashioned machine (the winch) just for comparison.
Figure 6.2.7: Weighted resource consumption for the dyeing process
System 1 and 2 versus the reference system, System 0
To compare with the above DLCAs the total LCAs of the
environmental impact and the resource consumption are outlined in Figures 6.2.8 and 6.2.9.
Figure 6.2.8: Weighted environmental impact potentials for a cotton T-shirt. System 1 and 2 versus the reference system, System 0
Figure 6.2.9: Weighted resource consumption for a cotton T-shirt. System 1 and 2 versus the reference system, System 0
The differences in the environmental impacts expressed in Figure 6.2.6 are too small to be visible in the full perspective due to other dominating processes in the life cycle.
The resource profile for the total product life cycle, Figure 6.2.9, shows, however, a significant change in the consumption of water. This is due to the rinsing stage in the dyeing process being very water consuming.
The process modifications of the assessed technology, reactive dyeing, thus have a large influence on environmental performance of the process but the positive influence of the modification is too small to be visible in the product dimension due to other dominating steps in the life cycle of the product.
6.2.3 Cleaner technology assessment in the product dimension
Investigated scenarios
A process modification can potentially influence the product properties and thereby its performance in other stages of its life cycle. Examples of some important ways in which this influence is seen are:
- affecting the lifetime of the product
- affecting product disposal
- affecting the performance of the product during use
To illustrate the environmental consequences of impacts that the technology potentially can have on the product and its life cycle, a number of scenarios have been analysed. These are shown in the following table.
Analysed scenarios to illustrate technology impact on product performance
Technology |
System
identification |
Technology
impact |
"State
of the art" |
System
0 |
Lifetime
of a T-shirt defined as one year |
Change
in lifetime |
System
3:
Improved fastness of the dyestuff |
Lifetime
of a T-shirt increased to 1.6 years.
Use stages unchanged, remaining stages reduced by 60%. |
| |
System
4:
Reduced fastness of the dyestuff |
Lifetime
of a T-shirt reduced to 0.5 years.
Use stages unchanged, remaining stages increased by 100%. |
Change
in waste management |
System
5:
Waste scenario A: Incineration |
All
waste sent to municipal waste incineration plant, including recovery of
energy.
Remaining product life cycle unchanged. |
| |
System
6:
Waste scenario B: Landfill |
All
waste sent to landfill.
Remaining product life cycle unchanged. |
Change
in use process |
System
7:
New finishing process |
New
surface treatment to reduce attachment of dirt. Use stage processes
reduced by 30%, remaining stages unchanged |
| |
System
8:
Low cost cotton fabric used |
The
surface of the T-shirt becomes more dirt adhering.
Use stage processes increased by 30%, remaining stages unchanged. |
Altered lifetime
One of the most obvious ways a technology can affect the lifetime of the T-shirt is the strength of the binding between the dyestuff and the cotton fibre. An increased dyeing quality could increase the number of withstandable washes and thereby the life span of the T-shirt. This would affect the product life cycle in a number of ways. First and foremost the number of T-shirts used per functional unit would decrease. Thus, environmental impact potentials throughout the product life cycle would decrease, i.e. consumption of raw materials and fossil fuels and related environmental impact potentials. In order to illustrate the consequences of altered lifetimes three examples have been chosen:
- System 0: 1 T-shirt per year (the reference)
- System 3: 0.6 T-shirts per year
- System 4: 2.0 T-shirts per year
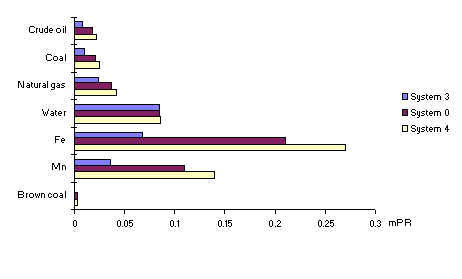
From Figures 6.2.10 and 6.2.11 it can be seen that even the rather limited alterations in lifetime in the examples give considerable reflections in the contribution to the environmental effects referring to the energy consumption. In the resource profile it is the consumption of water that is the decisive factor.
Figure 6.2.10: Weighted environmental impact potentials for a cotton T-shirt. System 3 and 4 versus the reference system, System 0
Figure 6.2.11: Weighted resource consumption potentials for a cotton T-shirt. System 3 and 4 versus the reference system, System 0
Environmental benefits gained by the cleaner technology process modification outlined in Figure 6.2.6 - about 0.0006 mPET referring to global warming - can be compared to disadvantages by lifetime shortening in Figure 6.2.10 - about 0.05 mPET with a 50% lifetime reduction referring to global warming. The benefits by the process modification can in this way be quantified to only about 1.2% of a lifetime shortening. If a lifetime shortening will result from the process modifications, the total environmental account will very easily grow negative.
The same calculations concerning the water consumption in Figure 6.2.7 - 0.25 mPR benefits by process modifications - respectively Figure 6.2.11 - 2 mPR loss due to 50% reduction lifetime reduction - quantifies the benefits by the cleaner technology solutions to about 13% of a life time shortening. The water savings in the new dyeing and rinsing processes is obviously of a quantity that can be noticed in the total resource consumption of the life cycle of the T-shirt, but only limited lifetime reduction due to the cleaner technology solution would give a positive account referring to the total resource account.
The lifetime must, however, be judged as a very decisive factor for the environmental performance of the T-shirt and as a factor that has to be watched very carefully whenever alterations in the life cycle of the T-shirt come up.
Altered disposal
T-shirts can be disposed of in several ways. In this work T-shirts are assumed to be collected by the municipal waste system after use. In 1990 in Denmark 26% of this waste was sent to landfills and the remaining 74% was incinerated with recovery of energy, this is anticipated in system 0.
An optimised system (system 5) is exemplified with all the household waste being sent to municipal waste incineration plants with energy recovery. Finally these are compared with a hypothetical example (system 6) where the used product is sent to landfills. These scenarios are illustrated in Figures 6.2.12 and 6.2.13.
Figure 6.2.12: Weighted environmental impact potentials for a cotton T-shirt. System 5 and 6 versus the reference system, System 0
The environmental profile, Figure 6.2.12 shows that the largest changes in the environmental impact potentials are seen in the global warming potentials. The large contribution from system 6 is a result of the anaerobic production of methane gas from landfills.
The resource profile, Figure 6.2.13, does not show any visible changes.
Figure 6.2.13: Weighted resource consumption potentials for a cotton T-shirt. System 5 and 6 versus the reference system, System 0
Calculations to quantify the environmental benefits gained by process modifications - in Figure 6.2.6 0.0006 mPET - compared to disadvantages by alterations in disposal procedures - in Figure 6.2.12 0.15 mPET - gives approximately 0.5%. Thus, the environmental impacts from the disposal stage can also be pointed out as decisive in the life cycle of the T-shirt.
Altered use
The environmental performance of the T-shirt during use will be illustrated by the following alterations:
New surface treatment of the textile as reduces the number of annual washing and drying processes by about 30% (system 7)
- Textile products produced from short fibred cotton gives a shaggy surface as increases the number of washing and drying processes by about 30% (system 8)
The alterations in the environmental performance of the two examples can be outlined with the help of Figure 6.2.5. The new surface treatment will result in a weighted global warming impact of about 2 mPET from use and the increased number of washing and drying processes will result in a weighted global warming impact of about 4 mPET from use - the product life cycle excl. use being unchanged. For a normal good quality T-shirt - i.e. one T-shirt used in one year - it is seen that the difference will amount to about 100%.
For a T-shirt the above mentioned alterations of the use stage are not the most likely to be caused by changes in the dyeing process. For a table cloth, however, this issue is relevant, because surface treatment of the textile is used in order to allow cleaning the cloth with a wet rag instead of washing, drying and ironing it.
For the T-shirt, however, another issue is very relevant, namely the colouring of other textile products during washing in the use stage. Just one case of such colouring will result in the shortening of the lifetime of maybe 10 - 20 other textile products resulting in very large environmental impacts. The washing fastness of the T-shirt is thus a decisive product property that should not be negatively influenced by the process modification in the dyeing and rinsing.
Alterations in the use processes are as well as the life time seen not to have very decisive influence on the environmental performance of the T-shirt.
6.2.4 Technology specific environmental indicators, TSIs
Parameters resulting in significant environmental impact will for a specific technology relate to the process and/or to the product.
The process dimension of environmental performance
The process dimension of environmental performance is the performance of the process itself. In practice the workers at the dyehouse are aware of which process parameters, chemicals, etc. that are decisive for the environmental impact.
This environmentally performance of the dyeing process is very much related to:
- dyestuff fixation percent
- heavy metals in dyestuffs
- consumption of salt to perform the dyeing
- use of environmentally hazardous cations
- specific water consumption (l/kg textile)
- specific energy consumption (MJ/kg textile)
These properties are watched and are used for optimizations.
The product dimension of environmental performance
The product dimension of environmental performance is the influence of the process on the product's performance. In this case first and foremost the lifetime of the T-shirt but also the performance in the other stages of the life cycle, e.g. performance during use.
The environmental performance of the product referring to lifetime is determined by a number of key properties:
- washing fastness
- rub fastness
- water fastness
Washing fastness
Washing fastness determines the durability of the colour during washing in the use
stage. The test is done by washing at 60°C in 30 min.
of the dyed textile together with white test textiles of cotton, wool, PET and PA. Washing
powder without optical brightener must be used. Colouring of the test textiles are rated
on a scale from 1 to 5.
Rub fastness
Rub fastness determines how coloured a white cotton test textile gets when rubbed on
the dyed textile at 20°C, both dry and wet. Test
described in ISO 105-X12 (ASIM ISO 105-E01).
Water fastness
This determines the fastness of the dye during wear, 37°C
and moisturized at low pH (DIN 54006).
Referring to other stages in the life cycle there are several similar international approved product tests available.
6.2.5 Conclusions
In this case it is documented:
- that a cleaner technology should always be assessed both in the process and in the product dimension.
- that the product dimension, i.e. the life cycle of the product, can be influenced by the technology and that this influence is environmentally decisive.
- that 30-40% environmental improvement of the dyeing and rinsing processes can be lost by e.g. less than 1% shortening of the lifetime. Influences on the use and disposal stages are of similar importance.
- that environmental performance can be controlled by "technology specific indicators" which are the process parameters or product properties that are decisive to the environmental performance.
- that the environmentally important process parameters of dyeing and rinsing are well known and used routinely by process operators and managers in the textile industry. Similarly, the environmental properties are measured on a routine basis before products are sold.
6.3 Surface treatment case: Zinc plating of steel sheet
Process to be assessed
The process to be assessed in the present case is the zinc plating of steel items. Even though there are many varieties of zinc plating: 1) Cyanide zinc, 2) Cyanide free alkaline zinc, 3) Acid zinc and many others - zinc plating is considered as a general technology. Zinc plating is the most widespread plating process in the world, and regardless of the type of zinc plating, the cleaner technologies influencing the environmental performance of the processes, are the same.
Product to be assessed
The product that is to be assessed in the present case is a zinc plated steel sheet, used, for example, in a washing machine.
Superior service
The superior service of the zinc plating is to serve as rust prevention of steel items. In this case a zinc plated steel sheet has been chosen to represent the product. The functional unit is:
The functional unit
A zinc plated steel sheet with the dimensions 1m x 1m x 0.0006m with a lifespan of 14 years.
(This does not mean that the object is worn out after 14 years).
6.3.1 Reference technology, process and product dimension
The reference process: Zinc plating, alkaline, cyanide free
The process of zinc plating (a reference, without any cleaner technologies implemented) is shown in a schematic outline in Figure 6.3.1.
Figure 6.3.1: Zinc plating process
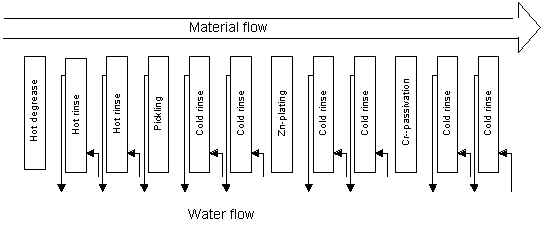
Degreasing, rinsing
The steel sheet is degreased in a hot alkaline solution. Afterwards it is rinsed in two hot rinses, having separate water supply, and steam is used for heating. No reuse of rinse water in the pre-treatment operations.
Pickling, rinsing
In order to neutralize the degreaser and to remove any oxide film or layer of corrosion product, the sheet is pickled in a solution of muriatic acid (HCl). After pickling, the sheet is rinsed in cold water having a separate water supply.
Zinc plating, rinsing
Zinc plating is carried out in an alkaline, cyanide free solution, at room temperature. The plating thickness is approx. 10?m. The solution consists of sodium hydroxide, zinc oxide and some proprietary brighteners. After plating, the sheets are rinsed in two tanks, having a separate water supply. There is no backfilling of rinse water to the plating bath.
Passivation
The zinc-plated sheets are finally immersed into a chromic acid (Cr(VI)) based, passivation solution, which forms good adherence properties for subsequent painting. The parts are rinsed in two tanks having a separate water supply. No reuse of water takes place.
Drying
The last operation in the zinc plating line is the drying, using hot air.
The reference product: Life cycle of a zinc-plated steel sheet
A simplified life cycle of a steel sheet is shown in Figure 6.3.2.
Figure 6.3.2: Lifecycle for a zinc plated steel sheet
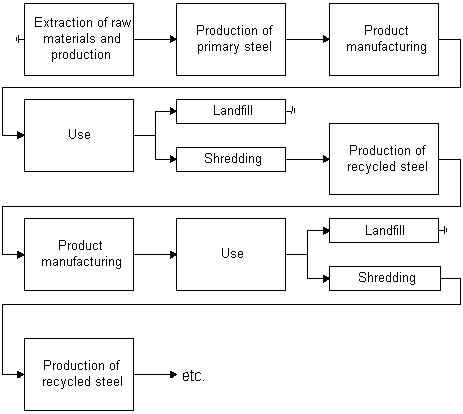
Extraction of raw materials
The life cycle of steel sheets starts with the extraction of the various raw materials all being components in steel.
Production of primary steel
The production of primary steel is the first production process in the life cycle of steel, where the steel is processed into metal sheets or other intermediate products.
Product manufacturing
In this stage the steel is processed and given those qualities desired in the product in which it is to be incorporated.
Use
The use stage is not of interest in this work. This is due to the defined functional unit, where there are no environmental interventions from the use stage.
Disposal
After use the product in which the metal sheet is a part of is disposed. There are two ways in which this product will be disposed of as shown in Figure 6.3.2. If the product is sent to landfill the steel sheet will be treated as bulk waste. If the product is recovered via a shredder the steel will be reused in other products. After the shredding process the steel is ready to be processed into new products via melting. In order to obtain a uniform steel quality in recycled products the recycled steel is mixed with a fraction of primary steel. After this process the steel is again ready to be processed for use in new products. Zinc evaporates from the steel melt and ends as dust in an exhaust filter. Afterwards it can be sent for recycling.
It is in the product manufacturing that we find the zinc-plating process.
Discussion of process versus product system
In a product life cycle, Figure 6.3.2 we are provided with an allocation problem. This is due to the recycling of steel. The allocation is done by use of a material grade allocation as described in the Danish EDIP method and will not be described further.
Environmental impacts
From a product LCA of zinc plated steel sheets (system 0), Figures 6.3.3 and 6.3.4, it can be seen that the extraction of raw materials and processing of these is the most dominant stage.
Figure 6.3.3: Weighted environmental impact potentials for a zinc-plated steel sheet
In all the impact categories in the environmental profile this stage is dominant or very noticeable. The zinc plating process is not the most dominant, but is still very noticeable, except in the formation of photo-chemical ozone. The only impact derived from landfill is that of bulk waste and here it can be characterized as the dominant stage. The impacts from the shredding process are mostly derived from energy consumption. The production of recycled steel sheets is also noticeable in most of the impacts, but mostly in the contribution to global warming.
Regarding toxicity, human, eco and persistent it can be seen that the raw materials extraction process and the zinc-plating process are the most significant.
Figure 6.3.4: Weighted resource consumption for a zinc plated steel sheet
The resource profile, Figure 6.3.4, is also characterized by the extraction and processing of raw materials. The only other processes that are noticeable is the production of recycled steel (natural gas) and zinc-plating (water).
The assessed technology, zinc plating contributes to the products environmental performance in several ways. The contributions to the environmental interventions from the product are not very large and a reduction of these would not change the environmental profile of the product much, but a reduction in the consumption of water would give considerable changes to the resource profile and it would also eliminate the discharge of zinc from the process.
Often an increased quality of the zinc plated steel item would not change the lifetime of the item. This is due to the item often being part of a larger product, e.g. a washing machine where other factors as the lifetime of the motor or electronics would be the decisive factor of the lifetime of the product.
The process dimension of environmental performance is the performance of the process itself.
This performance relates:
- consumption of chemicals
- consumption of water
- consumption of energy
- emissions to air
- emissions to water
- emissions to soil
The product dimension of environmental performance
The product dimension of environmental performance is the technology's influence on the product's performance. The environmental performance of the product is determined by a number of key properties. In the case of a zinc-plated steel sheet these are:
- Corrosion resistance (ASTM B 117 salt spray test, ISO 3768)
- Adhesion (ASTM B 517, ISO 2819)
Investigated scenarios
In order to identify the various EPIs at level 2 in the indicator model several systems have been assessed and compared. These systems are:
System 0 |
One
functional unit.
Fraction of steel recycled after use = 40% |
System 1 |
Lifetime of
zinc-plated steel sheet increased to 20 years |
System 2 |
Lifetime of
zinc-plated steel sheet reduced to 10 years |
|
|
System 3 |
Fraction of
steel recycled after use increased to 90% |
System 4 |
Fraction of
steel recycled after use decreased to 20% |
System 5 |
Introduction
of cleaner technology in the zinc plating process |
iscussion of process versus product system
Identification of level 1 EPIs
In this work primary level EPIs are defined as those EPIs derived directly from the preliminary LCA, e.g. global warming, acidification, etc. In the following different alterations to the product system are simulated and used to identify EPIs derived from alternated processes/stages. These are:
Product
- altered lifetime of the zinc-plated steel sheet, e.g. the washing machine. As mentioned earlier, this is not done by increasing the quality of the zinc plating, but other qualities in the washing machine.
Product
- altered disposal scenarios.
Product + process
- implementation of cleaner technology solutions in the zinc plating process. The product and product quality is unchanged.
Comparison of products (LCA)
The following is an investigation of the results of altered stages in the product life cycle.
Simulation of altered lifetimes of the zinc plated steel sheet
Lifetime
In order to illustrate the consequences of altered lifetimes three examples have been chosen:
- System 0: 1 zinc-plated steel sheet per functional unit.
- System 1: 0.7 zinc-plated steel sheet per functional unit.
- System 2: 1.4 zinc-plated steel sheet per functional unit.
The systems are illustrated in Figures 6.3.5 and 6.3.6.
Figure 6.3.5: Weighted environmental impact potentials for systems 0, 1 and 2
Figure 6.3.6: Weighted resource consumption for systems 0, 1 and 2
If one looks at the environmental profile, Figure 6.3.5, it can be seen that the life time of the zinc-plated steel sheet has a considerable effect on all the contributions to the environmental impacts. In the resource profile, Figure 6.3.6, the same can be seen.
Altered disposal scenarios
In Western Europe 40% of used steel is recycled. The remaining 60% is sent to landfill. This is illustrated in system 0.
An optimized system (system 3) is exemplified with 90% of the used steel being recycled and finally system 4 shows the effects when 80% of the used steel being treated as landfill waste.
A comparison of these systems is shown in Figures 6.3.7 and 6.3.8.
The environmental profile, Figure 6.3.7 shows considerable reductions in contribution to all impacts, especially toxicity and bulk waste, when increasing the recycling fraction.
Figure 6.3.7: Weighted environmental impact potentials for systems 0, 3 and 4
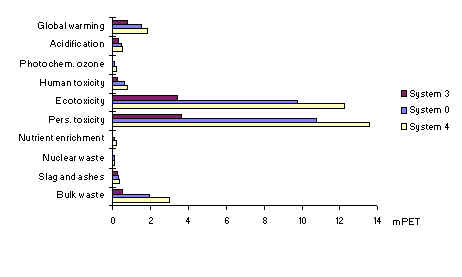
Figure 6.3.8: Weighted resource consumption for systems 0, 3 and 4
The resource profile, Figure 6.3.8, shows the same tendencies as the environmental profile. The only deviation is that of water consumption. This is due to the zinc-plating process being the main contributor to this impact as shown in Figure 6.3.4, and is not influenced by alternating disposal systems.
Comparison of technologies
Process
As mentioned earlier the investigated process is that of zinc plating. In a cleaner technology project done by the IPU the main differences between the old process (system 0) and the new "cleaner" process (system 5) are:
- The plating metal is kept in the process line
- The water consumption is reduced to a minimum
- Hot rinses are converted to room temperature rinses
- In return, there is a consumption of evaporation power in the reverse flow system.
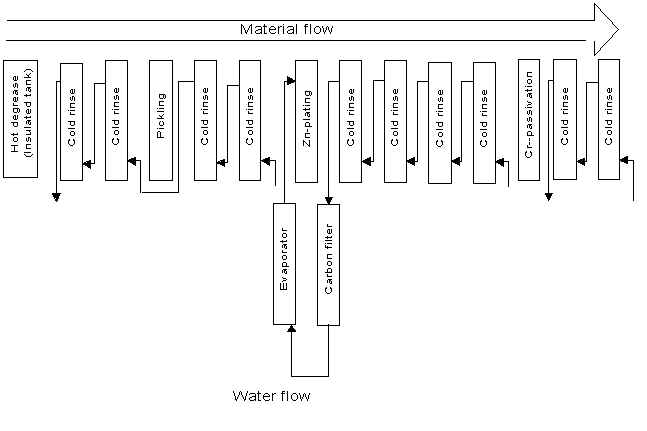
The new process is shown in Figure 6.3.9.
Figure 6.3.9: Process diagram for modified, "cleaner" zinc-plating process.
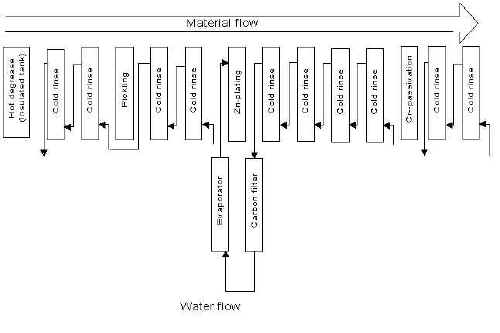
[ Click on the figure above to view a larger version of Figure 6.3.9 ]
Enclosed graphs, see appendix, show the importance of introducing extra rinse tanks to reduce the water consumption and thereby the evaporation need and the extra power need for this purpose. The Figures for the two situations are as follows:
In the case of an annual production of zinc plating of 70,000 m2 the water need for rinsing in a 4-tank-system will be 190 m3/year presuming that the rinse criterion (concentration in the last rinse) is: 1 ppm.
Presuming that the rinse criterion is unchanged and the annual production also is the same, the water need in a 2-tank-system will be 2650 m3/year.
The environmental and the resource profiles of the product system are shown in Figures 6.3.10, 6.3.11 and 6.3.12.
Product
As presumed the environmental profile in Figure 6.3.10 does not show any considerable reduction in environmental impact, except from a small decrease in the impacts from eco and persistent toxicity.
Figure 6.3.10: Environmental profile for product systems 0 and 5
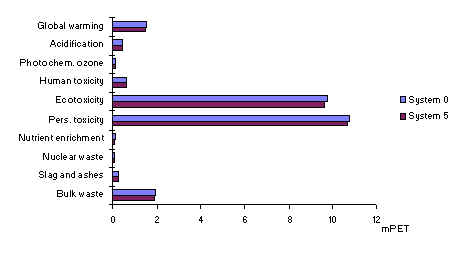
Figure 6.3.11: Environmental profile for zinc plating process, system 0 and 5
If one only looks at the zinc-plating process, illustrated in Figure 6.3.11, the reductions are much more significant. Here the reductions of eco and persistent toxicity are more noticeable.
As Figure 6.3.10 the resource profile of the whole product system, Figure 6.3.12, only shows very few changes. All the fossil fuels and metals are virtually unchanged, but the water consumption is reduced by approx. 50% (the resource profile for the process does not reveal any other changes and is therefore not shown).
Figure 6.3.12: Resource profile for product systems 0 and 5
Discussion of process versus product system
Comparing the reference system to the simulations several conclusions can be made:
- There is not one stage of the product life cycle which dominates, but different stages dominate different impact categories.
- The investigated cleaner technology scenarios result mainly in a reduction of ecotoxicity, persistent toxicity and water consumption.
- If an overall reduction of the impacts is desired it is necessary to combine various changes, e.g. increased recycling rate and introduction of cleaner technologies in the zinc plating process.
- Cleaner technology initiatives that have an effect on the product quality, do not always affect the product life time, because this is often decided by other factors.
- At this stage nothing can be concluded regarding the working environment, though it is certain that this impact would have a considerable effect on the appearance of the final profiles.
The product dimension, key product properties
Depending on the use of the zinc-plated product the importance of the quality will vary. In products like a washing machine the zinc-plated steel will not have much of an effect, but if the zinc-plated object can be identified as the significant part of a product, e.g. a lamp post, the quality will be of the highest importance.
According to the involved parties the quality can be measured by the following quality tests/key product properties (these have been quantified earlier, and will therefore not be explained further here, but just stated):
- Corrosion resistance
- Adhesion
The process dimension
Changes in the process dimension will not have any considerable effects on the environmental interventions. There are only few exceptions: eco, persistent toxicity and water consumption. Expressed as EPIs these are:
- Dragout of Zn (heavy metals) and chemicals
- Water consumption
|

Document Actions
Share with others